Dealing with datetimes like a pro in Pandas

In my previous article (https://codeburst.io/dealing-with-datetimes-like-a-pro-in-python-fb3ac0feb94b), I was writing about challenges related to the datetime type in Python. My recommended approach for solving them was to use Pendulum library (https://github.com/sdispater/pendulum).
But guess what?
Pandas can solve those problems just as well!
What is Pandas?
Pandas is an open-source Python library designed for data analysis. If you haven’t heard about it before, check out the comprehensive documentation here: http://pandas.pydata.org/.
Challenge #1: Parsing datetimes
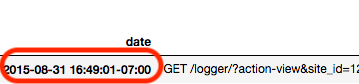
Let’s see how Pandas would help with your Google Analytics-like application. In that application, you were parsing log lines that looked like this:
Here is how you’d do that with Pandas:
This code:
- reads the log lines
- splits each lines into parts, preserving only the relevant fields, and
- converts the resulting list of tuples into a Pandas DataFrame.
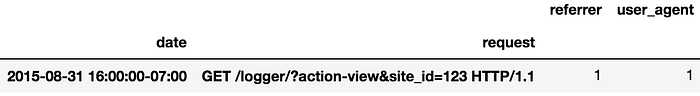
Think of the DataFrame object as a table-like structure. It has 4 columns and contains the following data:

At this point, every field is still a string (or, to be exact, a numpy object). Now you got to the datetime parsing part:
The code above:
- provides the format string, because the log file uses a non-standard date format (date and time parts are separated by a colon “:” instead of a space “ ”)
- provides utc=True, to tell Pandas that your dates and times should not be naive, but UTC.
That’s all it takes.
Challenge #2: Displaying datetimes with timezones
First, let’s use your date field as the dataframe’s index. This will give you a DatetimeIndex with lots of useful methods:
Now, you can convert datetimes to the user’s timezone:
And get a localized dataframe:
Challenge #3: Rounding (truncating) datetimes
To aggregate things on an hourly frequency, you have to round datetimes down to an hour. DatetimeIndex has a method for that:
In case you wanted to round up to an hour, there’s a corresponding ceiling method.
Now, to count things in this dataframe, group by date and request:
Here is your aggregate:
Challenge # 4: Finding edges of an interval
Here is how you can calculate the start of a week:
And the start of next week:
Challenge #5: Creating ranges
Creating a range of dates is extremely easy. You can define the number of points you need:
Or provide a start and end date, and generate every point in between:
I would not necessarily recommend installing Pandas just for its datetime functionality — it’s a pretty heavy library, and you may run into installation issues on some systems (*cough* Windows). But if you already use Pandas to process data, there’s no need for any additional libraries to deal with datetimes. You have this great tool right there, in Pandas’ toolbox.

