Debugging Nuxt.js with Visual Studio Code

As I’ve started using FeathersJS with Nuxt.js, I’ve needed a way to debug the Server Side Rendering (SSR) process. As usual, Visual Studio Code’s excellent debugger is wonderfully simple to setup. Here are the steps to debugging your Nuxt.js apps with Visual Studio Code.
This article assumes you used the Nuxt.js template for the vue-cli. If you are integrating Nuxt.js into your Feathers application, or you are new to debugging or Visual Studio Code, you may want to read my article on Debugging Feathers with Visual Studio Code.
- Open your project in Visual Studio Code and go to the Debug panel (⌘⇧D on a Mac)
- Click the little ⚙️ icon at the top and select
Node.jsas the environment. - Click the
Add Configurationbutton in the bottom right corner and selectNode.js: Launch via NPM - Change the new configuration’s second
runTimeArgfrom “debug” to “dev-debug”. This points to adev-debugscript that we’re going to make in the next step. Thelaunch.jsonshould look like this:
- Create a new
dev-debugscript in yourpackage.json:
"dev-debug": "node --debug node_modules/.bin/nuxt",Just in case you’re new to this, below is what the scripts in your package.json should look like when you’re done. The other scripts come, by default, with a new Nuxt.js installation using the vue-cli.
"scripts": {
  "dev": "nuxt",
  "dev-debug": "node --debug node_modules/.bin/nuxt",
  "build": "nuxt build",
  "start": "nuxt start",
  "generate": "nuxt generate",
  "lint": "eslint --ext .js,.vue --ignore-path .gitignore .",
  "precommit": "npm run lint"
},
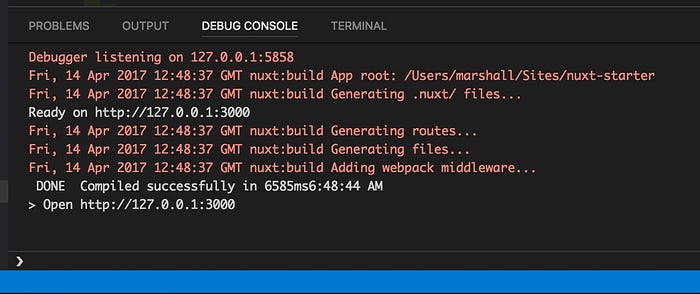
That’s it. Launch the debugger with the new configuration (⌘F5). You’ll see the Debug Console panel pop up at the bottom of the screen:

Set some break points. It even works in your node_modules packages. now you can get a better picture of what’s happening when things aren’t going right. Happy debugging!

