Getting Started with Data Visualization — Build Your First Chart With D3.js
Learn the basics of D3 and make a chart!
Hey everyone! Here’s a codepen of what we’re going to learn how to build in the next 15 minutes:
Boilerplate Code
You can either use the codepen above to follow along, or you can use this boilerplate HTML file below. You would simply put all of your D3 within the <script> tags on line 13:
Quick Intro to D3 & SVG
If you’ve never heard of D3, here’s the definition straight from the documentation:
D3 (Data-Driven Documents or D3.js) is a JavaScript library for visualizing data using web standards. D3 helps you bring data to life using SVG, Canvas and HTML. D3 combines powerful visualization and interaction techniques
Before getting started with D3, it’s important you understand what SVGs are. SVGs are Scalable Vector Graphics. They are graphics that are defined in an XML format and not lose quality when they are zoomed in on and resized.
Luckily, SVG’s are very easy to get started with. Lets take a look at some sample code that creates a red rectangle:
<svg>
  <rect width='50' height='200' style='fill:red'/>
</svg>
As you can see the code is pretty straight forward — we have an SVG tag and within that SVG tag we have a self-closing rect tag. The rect tag is used to create — you guessed it — rectangles! Within our rect tag we only need to define the width, and height, but I’ve also defined a color for our rectangle via the style attribute. When placed into an html file, we get this:

Awesome. A rectangle. D3 is simply a library that enables us to build and do some really, really, cool things with SVGs (among others).
Ready? Lets get started!
Want to learn more data visualization and advanced JavaScript? Check out the Advanced Web Developer Bootcamp here.
Making a Rectangle in D3
Now we’re going to recreate our exact rectangle that we made in SVG, but we’re going to do it with D3.
The first thing we need to do is utilize the select() method. With this method we can pass in a reference to the DOM node that we want to select. Put simply, we can select an element within our HTML using this method. We’ll be selecting the body of our webpage:
d3.select('body')Awesome. Now that we’ve selected the element we want to put our visualization within, we can start creating it. First we’ll add in our <svg> tag:
.append('svg')Next, within our <svg> tag we need to add a <rect> tag to create our rectangle:
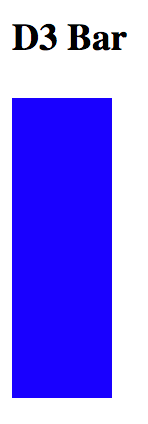
.append('rect')Now that we’ve created our rectangle, we can add in our width, height, and any styles.
  .attr('width', 50) .    // set width
  .attr('height', 200)    // set height
  .style('fill','blue');  // set color
And that’s it! Now when we refresh the page we’re presented with the exact same rectangle we created before (with a different color of course)
Now, this was obviously more work to use D3 than it was to just create the rectangle from scratch with SVG. That’s because this was an ultra-simplistic example. Once we get into complex examples, it very quickly becomes much easier to use D3.
Lets Make A Chart
A bar chart is essentially just a bunch of rectangles. So to create one, we just need a bunch of rectangles of different lengths. It’s a little more complex than that, but lets just jump in and start building.
The first thing we need to do is create our svg canvas. We want our canvas to be placed within the body of our website, and we’re going to build a canvas that is 400px wide, and 250px tall
const w = 400;
const h = 250;let svg = d3.select('body')
            .append('svg')
            .attr('width', w)
            .attr('height', h);
Awesome. Now we have a variable named svg that references our newly created svg element.
We now need to select the rectangles within our svg element. We can do this using the selectAll method. This method will select all of the rect elements within our svg.
But remember, we don’t have any rect's created yet. That’s Ok! This part can be kind of confusing, but essentially we’re telling D3 to be patient while we create these rectangles:
svg.selectAll('text')Now we can add our data to the svg canvas using the data() method:
We’ll be using the following data:
const data = [50,100,150,200,250,130,210,30,170];We can chain this on using:
.data(data)Awesome. Now we need to tell D3 to create placeholder elements for each of our data points. We do this using .enter()
Here’s what our code looks like so far:
svg.selectAll('rect')
  .data(data)
  .enter()
Everything beyond this point will be applied to all of our nine data points individually.
The first thing we’ll do is append a rectangle for each data point and set some attributes on those rectangles. Since I’m going to be setting multiple attributes for each rectangle, I’m going to use the .attrs({}) method which allows us to apply multiple attributes at once using an object:
.append('rect')
    .attrs({
      // attributes here
    })
The five attributes we’ll need for each rectangle are x, y, width, height, and fill.
x— the starting value (left-right) of each rectangley— the starting value (up-down) of each rectangleheight— the height of each rectangle fromywidth— the width of each rectangle fromxfill— the fill color of each rectangle
Before we can get working on these attributes, we need to understand how an SVG grid works. Recall from earlier that our SVG element is 400px wide and 250px tall. An SVG grid always starts in the top left hand corner, which is point 0,0 and moves down/right from there. This is probably a different starting point from most grid based systems that you’ve worked with in the past.
Check out this crude drawing to better visualize this:
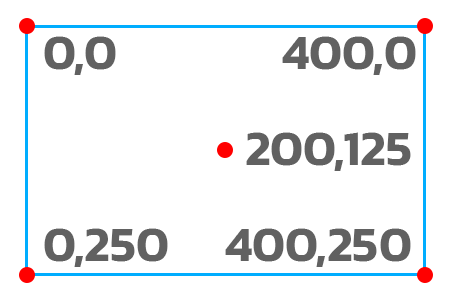
Cool. Now that you can visualize where data points are on our SVG canvas, lets go back to creating our attributes for each rectangle:
Our x values are pretty straight forward. If the width of our svg was 100px and we had 10 total elements, each would be 100 / 10 = 10. We can apply the same concept here. Our x value should be our width divided by the number of data points. We can then multiply this value times the index of the rectangle we are working with to ensure each rectangle is placed correctly:
x: (d, i) => i * (w / data.length)Our y value is a bit counter-intuitive. Recall that the SVG grid starts in the top, not the bottom. This means our y value will be the height of the SVG minus the current data point:
y: d => h - dThe width of each rectangle will be the width divided by the total number of rectangles. I’m going to also add in some small padding to separate our rectangles a bit:
const padding = 4;width: w / data.length - padding,
The height of our rectangle is simply our data point for that rectangle:
height: d => dFinally, the fill of our rectangle will just be green:
fill: 'green'If we put everything together so far… here’s the code:
const w = 400, h = 250;
const padding = 4;
const data = [50,100,150,200,250,130,210,30,170];let svg = d3.select('body')
            .append('svg')
            .attr('width', w)
            .attr('height', h);svg.selectAll('rect')
  .data(data)
  .enter()
    .append('rect')
    .attrs({
      x: (d, i) => i * (w / data.length),
      y: d => h - d,
      width: w / data.length - padding,
      height: d => d,
      fill: 'green'
});
And if we run this code we get:
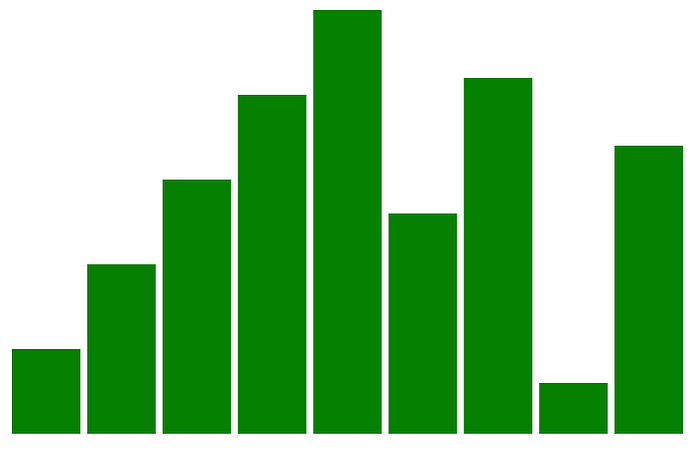
Awesome! We’ve got a basic bar chart built. But we’re not done yet. Now we’re going to add some text overlay to our chart.
Adding the Text
Adding our text begins with a nearly identical code to creating the rectangles:’
svg.selectAll('text')
  .data(data)
  .enter()
    .append('text')
Remember, this code says to D3:
- Select all the
textelements within oursvgelement. Oh? We don’t have any? Cool. That’s fine. - Take this data, use it!
- Apply this data to each and every
textelement. Oh? We don’t have any? Cool, create placeholders. For each placeholder run the remaining code. - Actually create our
textelements for each element in our SVG.
Now that we’ve created our text elements we need to actually set our text, then add a few attributes.
Setting the text is quite straight forward in this instance:
.text(d => d)And we only need two attributes — the x and y locations of our text.
The y value is pretty straight forward. We want the height of the SVG minus the data point height, exactly the same y formula we used for our rectangle. I then add an additional 20 pixels in as padding.
The x value is a bit more complicated and involves a little math. Because we added padding, we can’t just use the i * (w / data.length) formula that we used for the rectangle. We have to add in this padding and then divide by two to get the center point of each rectangle:
x: (d,i) => i * (w / data.length) + (w / data.length - padding) / 2,
y: (d) => h - d + 20
Once we’ve done this, we can add a little css to beautify our text. Below I’m changing the font family, making the font weight, and anchoring the text in the center:
text {
  font-family: sans-serif;
  fill: #ffffff;
  text-anchor: middle;
}
And we’re done!
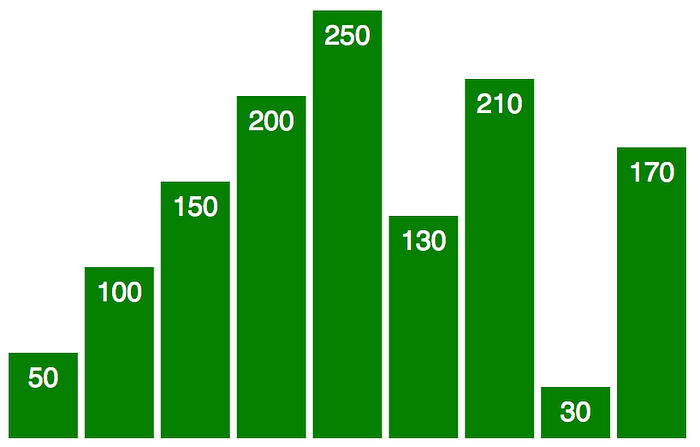
Here’s what our final code looks like:
Awesome! You’ve just built your first chart with D3. I know it can be a little overwhelming at first, but once you figure out the basics, it only gets easier.
Closing Notes:
Thanks for reading, and hopefully this was helpful! If you’re ready to learn more advanced JavaScript and Data Visualization, check out The Ultimate Guide to Learning Full Stack Web Development in 6 months.
I publish 4 articles on web development each week. Please consider entering your email here if you’d like to be added to my once-weekly email list, or follow me on Twitter.
