Google Kubernetes Engine Logging by Example
Exploring Google Kubernetes Engine (GKE) native integration with GCP Cloud Logging.

Google Kubernetes Engine (GKE) includes native integration with Cloud Monitoring and Cloud Logging. When you create a GKE cluster, Cloud Operations for GKE is enabled by default and provides a monitoring dashboard specifically tailored for Kubernetes.
— GCP — Overview of Google Cloud’s operations suite for GKE
Prerequisites
If you wish to follow along, you will need administrative access to a GCP project with a GKE cluster and Kubectl CLI configured for the cluster. One way to accomplish this is to have:
- Gcloud CLI installed and configured for your GCP project
- Terraform CLI installed
- A download of the hello-gke-ops repository
- Kubectl CLI installed
The repository’s tf folder is a Terraform project to create a single zone/node GKE cluster. The project variables can be supplied using a terraform.tfvars file in the tf folder.
Once the cluster, named my-cluster, is created, you can configure Kubectl CLI for the GKE cluster.
Container Logs
The simplest logging example is accessing a running container’s logs. We create the Pod with a single container by applying the Kubernetes configuration file; logging-pod.yaml:
$ kubectl apply -f logging-pod.yamlWe, of course, can examine the container’s logs through Kubernetes’ access to the container engine’s logs.
$ kubectl logs logging \
  --namespace default \
  --container ubuntu \
  --timestamps \
  --tail=5
2020-11-29T01:00:12.841261038Z hello world
2020-11-29T01:00:42.842492521Z hello world
2020-11-29T01:01:12.843999136Z hello world
2020-11-29T01:01:42.845274671Z hello world
2020-11-29T01:02:12.846721077Z hello world
This approach, however simple, has issues:
However, the native functionality provided by a container engine or runtime is usually not enough for a complete logging solution. For example, if a container crashes, a pod is evicted, or a node dies, you’ll usually still want to access your application’s logs. As such, logs should have a separate storage and lifecycle independent of nodes, pods, or containers. This concept is called cluster-level-logging. Cluster-level logging requires a separate backend to store, analyze, and query logs. Kubernetes provides no native storage solution for log data, but you can integrate many existing logging solutions into your Kubernetes cluster.
— Kubernetes — Logging Architecture
With GKE, with Cloud Operations for GKE enabled, we can access the same logging information from Google Cloud Console, with the GCP project selected, from the menu:
Logging > Logs Explorer
We run the query:
resource.type="k8s_container"
resource.labels.cluster_name="my-cluster"
resource.labels.namespace_name="default"
resource.labels.pod_name="logging"
resource.labels.container_name="ubuntu"
Please note: In this example the cluster’s name is my-cluster.
and get the expected result:
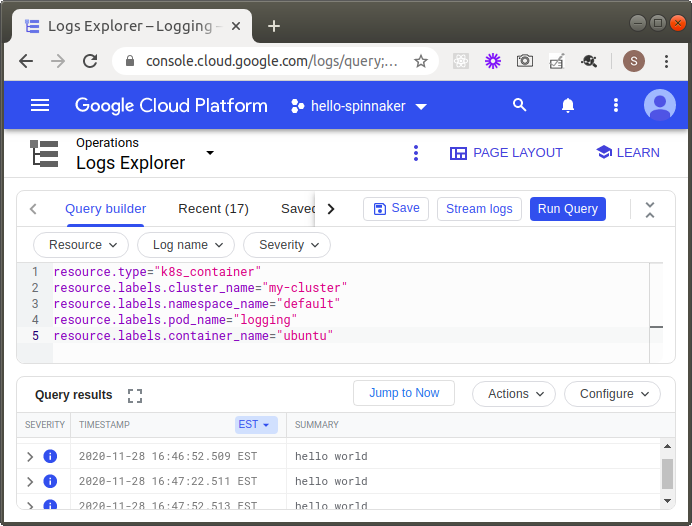
Things to observe:
- Unlike the container engine logs, these logs persist after the container, pod, node, and even cluster is destroyed
Crashing Container Logs
To illustrate the persistence of these Logs Explorer logs, in this example we access the logs of multiple containers of a single Pod which are continually crashing. We create the Pod with a single container by applying the Kubernetes configuration file; crashing-pod.yaml:
$ kubectl apply -f crashing-pod.yamlWe can obtain information about the crashing container from the container engine via Kubernetes, e.g., here we can see that the container has crashed three times and is waiting to restart:
$ kubectl describe pod crashing
Name:         crashing
Namespace:    default
[OBMITTED]
Containers:
  ubuntu:
    [OBMITTED]
    State:          Waiting
      Reason:       CrashLoopBackOff
    Last State:     Terminated
      Reason:       Error
      Exit Code:    1
      Started:      Sat, 28 Nov 2020 20:05:13 -0500
      Finished:     Sat, 28 Nov 2020 20:05:43 -0500
    Ready:          False
    Restart Count:  2
    [OBMITTED]
[OBMITTED]
Events:
  Type     Reason     Age                 From                                                Message
  ----     ------     ----                ----                                                -------
  Normal   Scheduled  2m7s                default-scheduler                                   Successfully assigned default/crashing to gke-my-cluster-my-node-pool-e64ab7d5-mr36
  Normal   Pulling    52s (x3 over 2m7s)  kubelet, gke-my-cluster-my-node-pool-e64ab7d5-mr36  Pulling image "ubuntu"
  Normal   Pulled     52s (x3 over 2m6s)  kubelet, gke-my-cluster-my-node-pool-e64ab7d5-mr36  Successfully pulled image "ubuntu"
  Normal   Created    52s (x3 over 2m6s)  kubelet, gke-my-cluster-my-node-pool-e64ab7d5-mr36  Created container ubuntu
  Normal   Started    51s (x3 over 2m6s)  kubelet, gke-my-cluster-my-node-pool-e64ab7d5-mr36  Started container ubuntu
  Warning  BackOff    7s (x3 over 65s)    kubelet, gke-my-cluster-my-node-pool-e64ab7d5-mr36  Back-off restarting failed container
Things to observe:
- Here we only get a count of crashed containers; not the specific timing of the crashes
We can also get the logs of a currently running container as before:
$ kubectl logs crashing \
  --namespace default \
  --container ubuntu \
  --timestamps \
  --tail=5
2020–11–29T01:12:29.960119582Z hello world
We can also get the logs of the previous, crashed, container:
$ kubectl logs crashing \
  --namespace default \
  --container ubuntu \
  --timestamps \
  --tail=5 \
  --previous
2020–11–29T01:11:58.874865549Z hello world
Things to observe:
- Here the container engine only stores two sets of logs; the current and previous container’s logs
Let’s look at these same logs using Logs Explorer; we first run the query:
resource.type="k8s_pod"
resource.labels.cluster_name="my-cluster"
resource.labels.namespace_name="default"
resource.labels.pod_name="crashing"
severity="WARNING
and get a list of the container crashes:
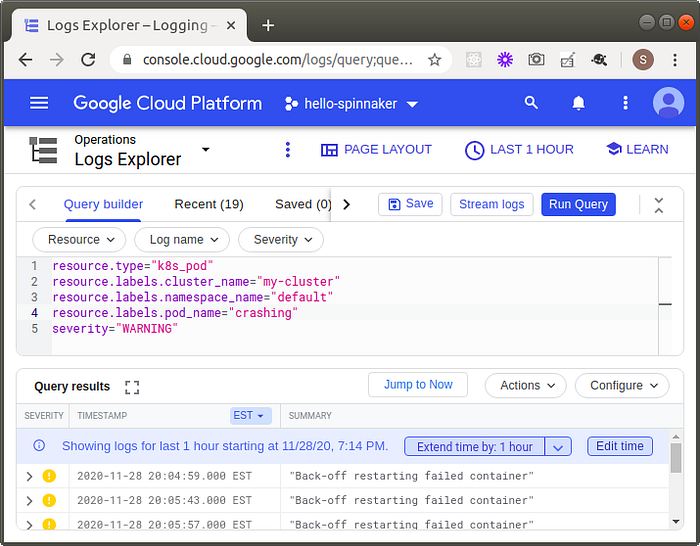
Things to observe:
- In addition to getting the number of crashes, we also get a timestamp of the crash with Logs Explorer
We can also run a query to get the logs from all of the crashed containers:
resource.type="k8s_container"
resource.labels.cluster_name="my-cluster"
resource.labels.namespace_name="default"
resource.labels.pod_name="crashing"
resource.labels.container_name="ubuntu"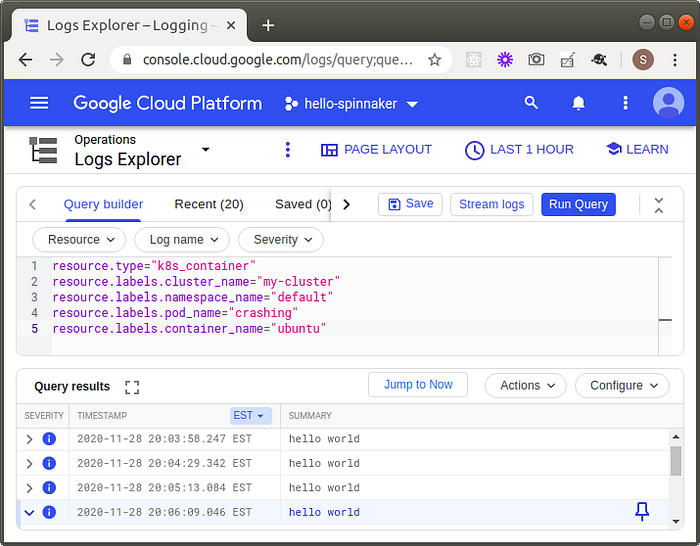
Things to observe:
- Because the storage of these logs is decoupled from the cluster resources, we can get the logs of all of the containers; not just the last two as we get from the container engine logging
Structured Logging
In the previous examples, the log output was plain text. If we output JSON instead, the output is stored as structured log entries in GCP Logs Explorer.
Structured logging: Single-line JSON strings written to standard output or standard error will be read into Google Cloud’s operations suite as structured log entries.
— GCP — Managing GKE logs
We create the Pod with a single container by applying the Kubernetes configuration file; structured-pod.yaml:
$ kubectl apply -f structured-pod.yamlAs before, we can examine the container’s logs through Kubernetes’ access to the container engine’s logs.
$ kubectl logs structured \
  --namespace default \
  --container ubuntu \
  --timestamps \
  --tail=5
2020-12-04T15:19:10.506243412Z {"hello": "there"}
2020-12-04T15:19:40.508211258Z {"hello": "world"}
2020-12-04T15:19:40.508269548Z {"hello": "there"}
2020-12-04T15:20:10.508820445Z {"hello": "world"}
2020-12-04T15:20:10.508868746Z {"hello": "there"}
We also can look at these same logs using Logs Explorer. This time, however, we can additionally query by data in the structured log entries:
resource.type="k8s_container"
resource.labels.cluster_name="my-cluster"
resource.labels.namespace_name="default"
resource.labels.pod_name="structured"
resource.labels.container_name="ubuntu"
jsonPayload.hello="world"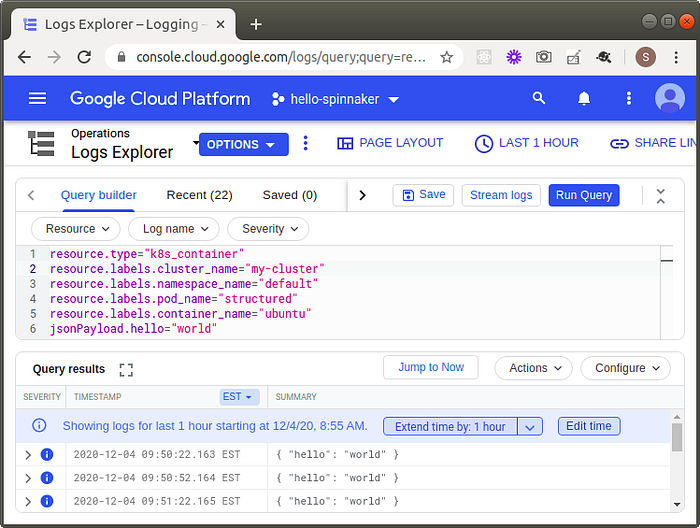
Severity
So far we have been only writing to standard out and the Logs Explorer log entries appear with a blue i icon (see figure above).
By default, logs written to the standard output are on the INFO level and logs written to the standard error are on the ERROR level. Structured logs can include a severity field, which defines the log’s severity
— GCP — Managing GKE logs
Let’s create an example where we also write to standard error. We create the Pod with a single container by applying the Kubernetes configuration file; severity-pod.yaml:
$ kubectl apply -f severity-pod.yamlWe examine the container’s logs through Kubernetes’ access to the container engine’s logs.
$ kubectl logs severity \
  --namespace default \
  --container ubuntu \
  --timestamps \
  --tail=5
2020-12-05T13:51:00.995382787Z {"hello": "world"}
2020-12-05T13:51:30.996740568Z {"hello": "error"}
2020-12-05T13:51:30.996834008Z {"hello": "world"}
2020-12-05T13:52:00.998367104Z {"hello": "world"}
2020-12-05T13:52:00.998454604Z {"hello": "error"}
Things to observe:
- Notice that with the Kubectl logs command, we get both the entries written to standard output and standard error
- It turns out that currently there is not a way to distinguish between standard output and standard error using kubectl logs
We also can look at these same logs using Logs Explorer querying by severity:
resource.type="k8s_container"
resource.labels.cluster_name="my-cluster"
resource.labels.namespace_name="default"
resource.labels.pod_name="severity"
resource.labels.container_name="ubuntu"
severity="ERROR"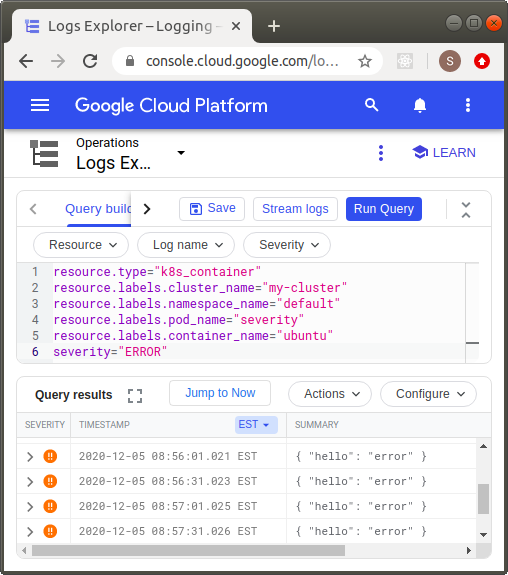
Things to observe:
- The log entries written to standard error appear with an orange !! icon
Alerting
So far, using logs has been a manual activity; i.e., we had to actively examine the logs. Here we will explore automating the process.
You can use logs-based metrics to set up alerting policies when Logging logs unexpected behavior.
— GCP — Managing GKE logs
In this example, we will use the logs from the severity pod to generate alerts from the log entries written to standard error, i.e., those showing up in Log Explorer with a severity of ERROR.
From Google Cloud Console, with the GCP project selected, from the menu:
Logging > Logs-based Metrics
We press the CREATE METRIC button.
Please note: As of this writing, creating logs-based metrics forces you into using the more primitive Legacy Logs Viewer.
We select the logs filter by navigating the menu tree:
Kubernetes Container > my-cluster > default > ubuntu
Things to observe:
- my-cluster is the cluster’s name
- default is the namespace
- ubuntu is the container’s name
- Here we cannot select which pod (weird)
We additionally, can filter by log level (severity), e.g., Error.
We name the metric, e.g., hello_error, and press the Create Metric button.

Interestingly enough, if we go back end edit the hello-error user-defined metric, we can update the log filter using the Logs Explorer interface; adding back in the pod filter:
resource.type="k8s_container"
resource.labels.cluster_name="my-cluster"
resource.labels.namespace_name="default"
resource.labels.pod_name="severity"
resource.labels.container_name="ubuntu"
severity>=ERROR
We can inspect this newly create metric by pressing the View in Metrics Explorer link on the hello-error user-defined metric.
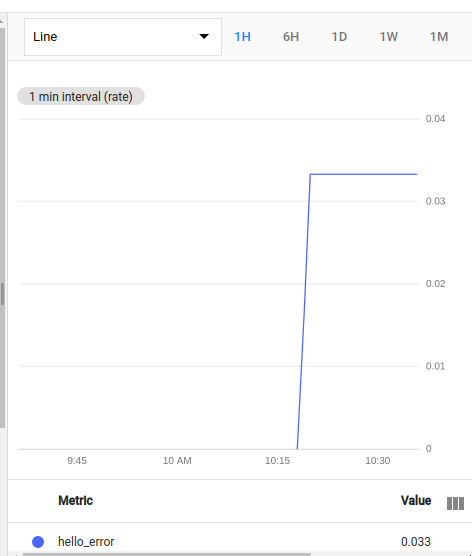
Things to observe:
- Unfortunately, I found the documentation on how these logs-based metrics are calculated to be confusing
- It turns out that the metric is calculated by counting the number of log entries every minute and dividing by 60; and can be interpreted as the number of log entries per second
- In our example, because our pod was emitting log entries every 30 seconds, the calculation here is 2 / 60 = 0.033
We can now create the alert by pressing the Create alert from metric link on the hello-error user-defined metric.
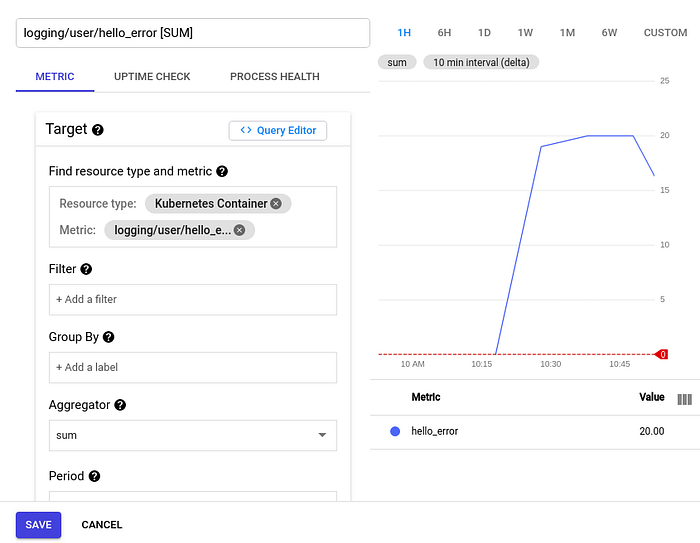
At first glance, it is not clear why the value here is 20. But it is more clear after we press the Query editor button:
fetch k8s_container
| metric 'logging.googleapis.com/user/hello_error'
| align delta(10m)
| every 10m
| group_by [], [value_hello_error_aggregate: aggregate(value.hello_error)]
| condition val() > 0 '{not_a_unit}'
Things to observe:
- The metric is 0.033 every second which aggregates to 20 over 10 minutes; 0.033 * 60 * 10 = 20
After saving the alert’s condition, we complete the Create alerting policy wizard; naming the policy hello_error. After a few minutes, we will begin to see the new alerting policy generating incidents.

Resource Types
So far we have been primarily focused on inspecting the logs generated from containers; in Logs Explorer we used a resource.type of k8s_container.
Earlier, we also used a resource.type of k8s_pod to observe the crashing containers.
As you might expect, there are two additional resource types: k8s_node and k8s_cluster. To get a sense of how to construct queries with these resource types, we will explore several provided by Google in Kubernetes-related queries.
We can examine the API requests made to the cluster, e.g., pod creation requests:
resource.type="k8s_cluster"
resource.labels.cluster_name="my-cluster"
log_id("cloudaudit.googleapis.com/activity")
protoPayload.methodName="io\.k8s\.core\.v1\.pods\.create"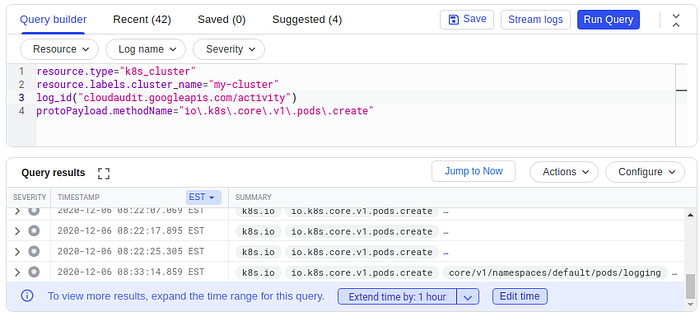
Things to observe:
- The log_id function returns log entries that match using the logName field
- Digging into the details of the log entry, we can observe the specifics of the API request; even who made it
We can also examine a node’s kubelet logs:
resource.type="k8s_node"
resource.labels.cluster_name="my-cluster"
resource.labels.node_name="gke-my-cluster-my-node-pool-208ac691-kwf3"
log_id("kubelet")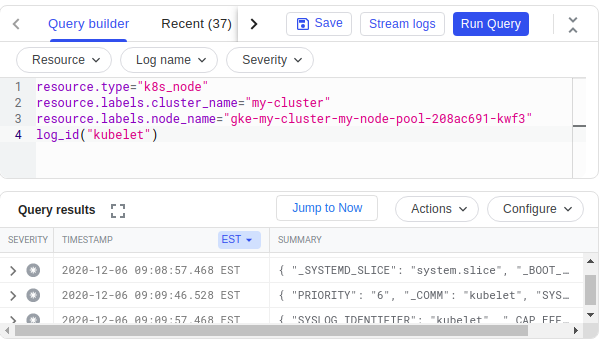
Wrap Up
Interestingly enough, this article ended up being much longer than I expected. Hope you found it useful.
