Improve Performance of Java Microservices with a Few Actionable Tips
Resolve performance issues in Java on the example of how to improve the performance of a Spring Boot microservice application by 15 times.
The great thing about microservices in Java is that they allow you to build large and complex systems from a number of independent components. Instead of having one application, you have many mini-apps or services. The components can be tested, deployed, and maintained independently from the rest of the architecture. So, if you take away one brick the whole building won’t topple over.
However, the apparent benefit of microservices may also be the spot where issues arise. If you’ve worked with Java microservices before, you’ll know that it may require a little more effort to tackle the performance issues in Java and get a high-performing app without the loss in functionality. But once you get to it, you may achieve fascinating results.
Spring Boot is a quick way to get started with building microservice architectures in Java. In this article, we’ll take a look at how to improve the performance of a Spring Boot microservice.
What you will use
We will use two Java microservices:
- External-service: “real-life” microservice accessible by HTTPs.
- Facade-service: this microservice will read data from external-service and send the result to clients. We are going to improve the performance of this service.
What you need
- Java 8
- Jmeter 5.3
- Java IDE
- Gradle 6.6.1
Download source
First of all, you need to download the source code which we’re going to be enhancing from https://github.com/vhavryk/java-performance.
External service
This service was created by spring initializer and has one controller simulating load:
@RestController
public class ExternalController {

 @GetMapping(“/external-data/{time}”)
 public ExternalData getData(@PathVariable Long time){
 try {
 Thread.sleep(time);
 } catch (InterruptedException e) {
 // do nothing
 }
 return new ExternalData(time);
 }
}
Run ExternalServiceApplication and access the service via https://localhost:8543/external-data/300.
Facade service
This one is another service created by Spring Initializer which has two major classes:
ExternalService class
Reads data from external service using externalServiceClient and calculates the sum of the times.
@Service
public class ExternalService {

 @Autowired
 private ExternalServiceClient externalServiceClient;

 public ResultData load(List<Long> times) {
 Long start = System.currentTimeMillis();
 LongSummaryStatistics statistics = times
 .parallelStream()
 .map(time -> externalServiceClient.load(time).getTime())
 .collect(Collectors.summarizingLong(Long::longValue));
 Long end = System.currentTimeMillis();
 return new ResultData(statistics, (end — start));
 }
}
ExternalServiceClient
We will use openfeign library to read data from external service. The current implementation of the HTTP client based on OKHttp library:
@FeignClient(
name = “external-service”,
url = “${external-service.url}”,
configuration = ServiceConfiguration.class)
public interface ExternalServiceClient {

 @RequestMapping(
 method = RequestMethod.GET,
 value = “/external- data/{time}”,
 consumes = “application/json”)
 Data load(@PathVariable(“time”) Long time);
}
Run FacadeServiceApplication class.
Call http://localhost:8080/data/1,500,920,20000.
The response will look like:
{
 “statistics”: {
 “count”: 4,
 “sum”: 1621,
 “min”: 1,
 “max”: 920,
 “average”: 405.25
 },
 “spentTime”: 1183
}
Preparing for performance run
Run Jmeter 5.3.1 and open the file perfomance-testing.jmx in the root of the source folder.
Performance Test Configuration:

We are going to load test the following URL: http://localhost:8080/data/1,500,920,200.
Go to Jmeter and press the start button.
Jmeter first-run results/analyses
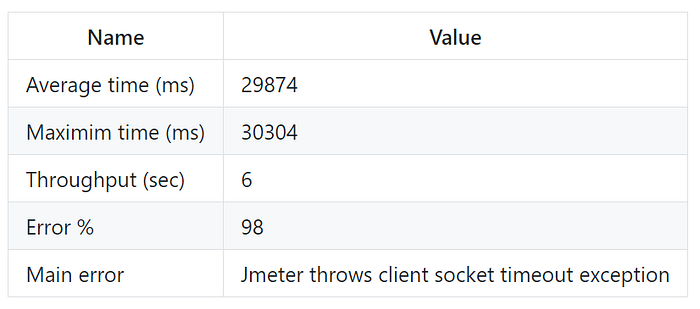
The server becomes unavailable. This is because we used a parallelStream() call in ExternalService. Java streams use ForkJoinPool to handle data in parallel mode. And by default, the parallelism of ForkJoinPool calculates using the number of available processors. In my case, there are three of them. For IO operations this is a bottleneck. So, let’s increase the parallelism of the ForkJoinPool to value 1000.
-Djava.util.concurrent.ForkJoinPool.common.parallelism=1000And run Jmeter again.
Jmeter second run results/analyses
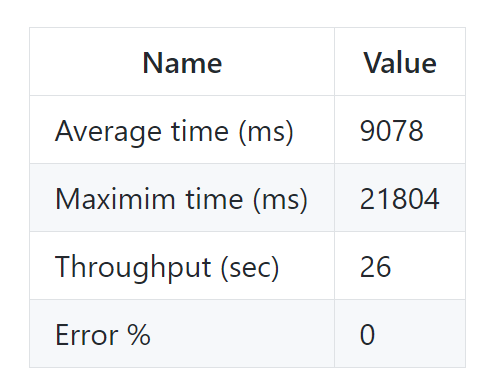
As you can see, we have improved performance from 6 rps to 26 rps. This is huge. Also, the service is stable with zero errors. But still, the average time is nineseconds. I have an assumption that this is because the app spends a lot of time on creating an https connection. Let’s add a connection pool:
@Configuration
public class ServiceConfiguration {

 …

 @Bean
 public OkHttpClient client()
 throws IOException, CertificateException, NoSuchAlgorithmException, KeyStoreException, KeyManagementException, NoSuchProviderException {

…

 okhttp3.OkHttpClient client = new okhttp3.OkHttpClient.Builder()
 .sslSocketFactory(sslContext.getSocketFactory(), trustManager)
 .hostnameVerifier((s, sslSession) -> true)
 .connectionPool(new ConnectionPool(2000, 10, TimeUnit.SECONDS))
 .build();

 OkHttpClient okHttpClient = new OkHttpClient(client);

 return okHttpClient;
 }
So, the app can keep up to 2000 https connections in the pool for 10 seconds.
Jmeter third run results/analyses
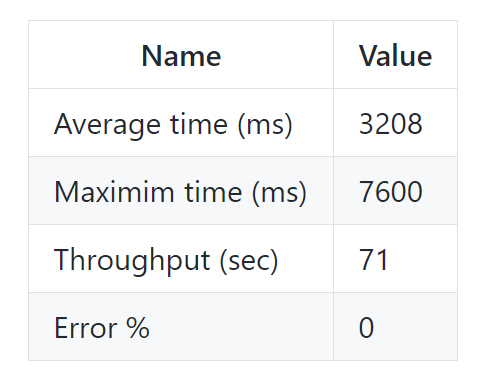
So, we improved performance by almost three times from 26 to 71 rps.
Overall, the performance improvement is 10 times from 6 to 71 rps, but we see that the maximum time is seven seconds. This is a lot because it affects the overall performance and UI clients will have shorter waiting times.
So, we need to limit the number of requests to handle. We can do this by using specified tomcat properties in application.properties:
server.tomcat.accept-count=80
server.tomcat.max-connections=80
server.tomcat.max-threads=160
The app will reject connection requests and send ‘Connection refused’ error to all clients once the number of connections reaches 160.
Jmeter forth run results/analyses

The maximum time now is up to five seconds with the increased rps from 71 to 94. Expectedly, the percentage of errors increased to 29%. All are ‘Connection refused’ errors.
Final words
In this article, we showcased a real scenario of how to improve performance by 15 times from 6 to 94 rps without any complex changes to the code. Also, the steps mentioned above allow for a decreased price of infrastructure like AWS. You might want to consider using microservices for your next project. Although a shift to serverless architecture is one of the Java trends that has been steadily on the rise for a few years now, you should take your best interests into account when considering such a transition.
These are common steps for improving the performance of a Java app that you might consider using. However, the article doesn’t cover some specific cases like working with databases. There’s still a lot to discover and experiment with when working with Java microservices. As we’ve just seen, these and other Java frameworks are advantageous for the overall success of your projects, with business benefits nonetheless.
Thank you for reading!
Please leave comments on how to improve this article or get in contact with me if you want to discuss things in more detail.

