Inspecting Animations With Chrome DevTools

Of the many Chrome DevTool options we have available, there is one that shouldn’t be overlooked: the Animation Inspector. This tool helps you get a better visual of your animations. It also provides some useful debugging actions, and the ability to adjust animation timing on the fly — without needing to make changes in the Element Inspector or your code editor.
In this article, we’ll cover the basics of the Chrome DevTools Animation Inspector and learn a few ways to help save time while working with animations.
The inspector is not just for developers! Designers will find it useful while collaborating with developers, researching animations for design inspiration, or as part of a design QA process.
Accessing the Animation Inspector
Once you have the devtools open (option + cmd + i on Mac), you can find the Animations tab by clicking the “Customize and Control Devtools” icon on the right side of the panel. Then go to “More tools”, then “Animations”.

It would be nice if this tab could be moved into the main tab row in dev tools, but I wasn’t able to find a way to move it. If anyone knows how, please comment!
Better Visuals
The first thing you’ll notice with the tab open is that it’s actively listening for animations on the page. Each time one occurs, a tile will appear at the top that contains specific info about the animation, or animation group, that occurred.
What’s an animation group?
The Animation Inspector predicts which animations are related based on start time (excluding delays and so on) and groups them all side-by-side. In other words, a set of animations all triggered in the same script block are grouped together, but if they’re asynchronous then they’re grouped separately (see the Chrome DevTools Animation Inspector Guide for more).
This is interesting and important, as animations can have several different properties to keep track of, especially when it comes to more complicated ones. The inspector helps us by grouping them together where applicable.

If you click on a tile, you’ll see a list of all the properties that changed as part of the animation and how much time elapsed. Also displayed are the HTML elements those properties belong to, which is helpful because it may not always be obvious.
Easy Replay
If you’ve worked with animations before, it’s likely you’ve had situations where running an animation meant repeatedly clicking a button, filling out a form, or performing some other tedious action over and over just to dial in the effect you wanted. This isn’t only annoying, but it’s really time-consuming; especially if your app or website doesn’t have hot reloading 😱.
Fortunately, the Animation Inspector provides a few options for easily replaying animations! Just make sure the animation has already run once, then click on the tile with the animation group you want.

1. Clicking the button above the element list lets you play or replay an animation. You can also use this same button to pause while the animation is playing.

2. You can use the red scrub bar to drag through an animation manually. Enable it by dragging across the top timeline area that displays the millisecond values. This gives you full control over the speed and overall playback.
Fine Tuning Animations
Another useful feature of the Animation Inspector is the ability to make changes to the properties and timings of your animations. Let’s use an example you can try while reading this article. If you click on the Medium comment bubble icon on the left of the page, a comment menu should transition in from the right side of the screen.

With the inspector tab open while this animation occurs, information about it will appear.

Now let’s imagine we’re working with a designer on this interaction, and they want to experiment by changing the order of these properties. Currently, the opacity and transform occur at the same time. Your designer wants the opacity change to occur first, and the menu transform to start only when the first is complete.
What we’d probably do in most cases for this request is jump into our code editor and make the change, or go into the dev tools element inspector and update the properties there. Now we have a third option!
Using the timeline, we can drag the transform property to start exactly where the opacity transition ends. Replaying the animation now should get us the results we want.
This may be a somewhat trivial example, but it demonstrates that we have an additional tool available when working with animations! Plus, any designer can inspect an animation in a more visual way without needing to know what CSS to change, and where.
Debugging
The visual nature of this tool helps with debugging animations too. Let’s use an animation that contains a lot of properties, one from stripe.com.
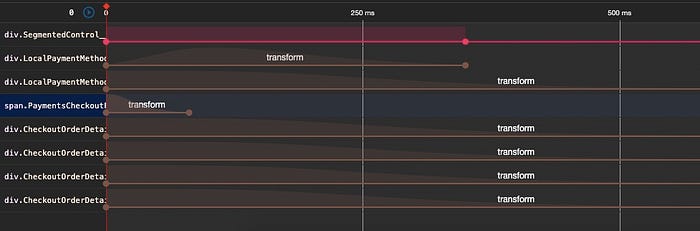
As you can see, there’s a lot happening here. Each element that is part of the animation appears in the list, so we can see if anything is missing, accidentally included, or if the timing is not correct. When working with complex animations, there’s often a lot of trial and error getting everything perfect, especially when dealing with different animation durations for different elements. With the Animation Inspector, everything is presented in a way that makes debugging much quicker.
Conclusion
I hope this article has helped shed some light on the Animation Inspector! I’ve personally found the replay and grouping functionality very helpful when working with complex animations.
If you enjoyed this article, you might like some of the other posts I’ve been writing on my blog.