Mastering Charts in VueJS

For this article, we are going to assume you have some background in Vue.js. If you do not run through some of my previous tutorials here.
Let’s start with a clean Vue app using the CLI.
$ vue init webpack mastering-charts-vueOnce you set up your app (the default values are fine) you will need to install the v-charts-plugin NPM module. This is a D3.js based charting library that can be used to create a variety of different customizable charts that bind data from Vue. We are going to use v-chart-plugin@0.2.9 which is the latest version as of this writing.
cd mastering-charts-vue/
npm i v-chart-plugin --save-dev
In order to enable the plugin in the app you are going to need to import the plugin into your Vue app:
import Chart from 'v-chart-plugin';
import App from './App';
import router from './router';Vue.config.productionTip = false;
Vue.use(Chart);
Let's start working on the main component. Assuming you followed the steps outlined above you should have a boilerplate Vue application. Go ahead and clean up some of the unnecessary markup in the component (We’ll use the default HelloWorld component that comes bundled with the template). Now add an object in the data with the details of the dataset: title, subtitle, width, height, and the dataset
export default {
name: 'HelloWorld',
data() {
return {
chartData: {
chartType: 'barChart',
selector: 'chart',
title: 'Student Grades',
subtitle: '2018 - 2019',
width: 600,
height: 300,
data: [98, 76, 85, 87, 63, 65, 90]
},
};
},
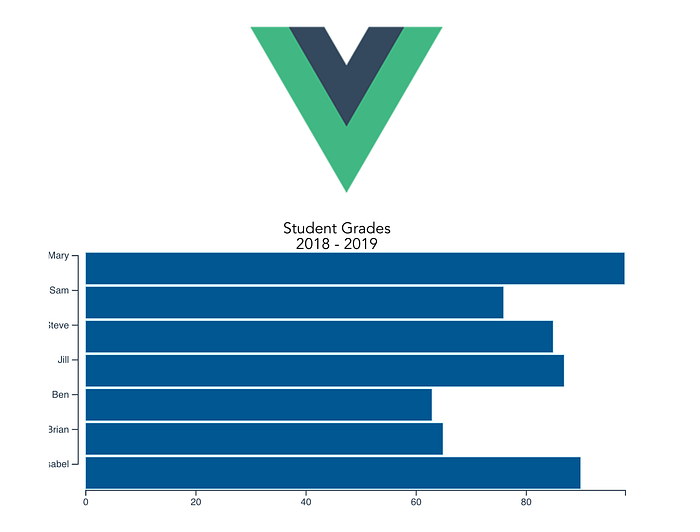
};Finally, we can add our directive to the template
<template>
  <div class="hello">
    <v-chart v-bind:chartData="chartData"></v-chart>
  </div>
</template>
Run the app and you should have a nice horizontal bar chart representing the data from the array:

In order to bind it to data in our Vue app we can move everything into an object. We’ll add some names to our dataset and we’ll configure it to match our dimensions and measures
const grades =
  [{ Name: 'Mary', s1Grade: 98, s1Grade: 95 },
    { Name: 'Sam', s1Grade: 76, s1Grade: 81 },
    { Name: 'Steve', s1Grade: 85, s1Grade: 84 },
    { Name: 'Jill', s1Grade: 87, s1Grade: 90 },
    { Name: 'Ben', s1Grade: 63, s1Grade: 75 },
    { Name: 'Brian', s1Grade: 65, s1Grade: 62 },
    { Name: 'Isabel', s1Grade: 90, s1Grade: 85 }];
export default {
  name: 'HelloWorld',
  data() {
    return {
      chartData: {
        chartType: 'barChart',
        selector: 'chart',
        title: 'Student Grades',
        subtitle: '2018 - 2019',
        width: 600,
        height: 300,
        metric: 's1Grade',
        dim: 'Name',
        data: grades
      },
    };
  },
};
This is good. Now we may just want to tweak some of the configuration settings to change the colors, the width of the label and the number of tick marks.
chartData: {
  ...
  data: grades,
  overrides: {
    palette: {
      fill: '#34495E',
      stroke: '#41B883'
    },
    x: {
      ticks: 20
    },
    y: {
      axisWidth: 40,
    }
  }
},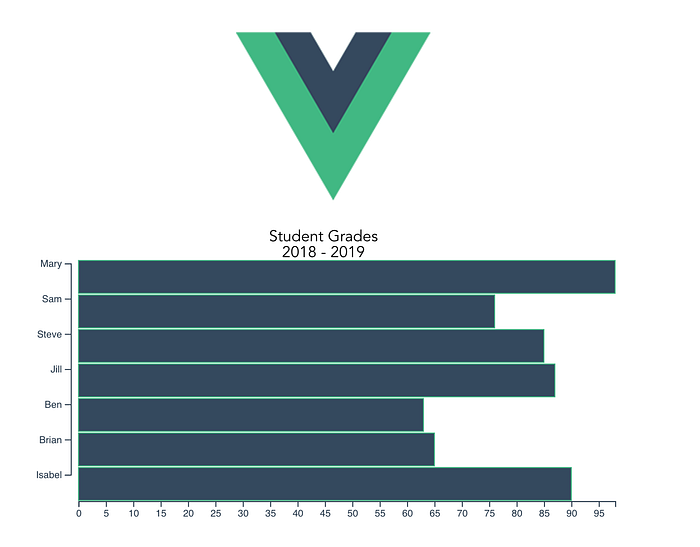
Viola. We have a customized chart bound to our Vue data. Bind this to the other UI components in your application and you can have reactive charts that respond to user input. There are about a half-dozen varieties of charts currently available in v-chart-plugin but there are a number of additional visualizations coming up in the upcoming releases.
Update — Version 0.3.0
On Monday we released alpha version 0.3.0 of v-chart-plugin. We have added some substantial changes to the
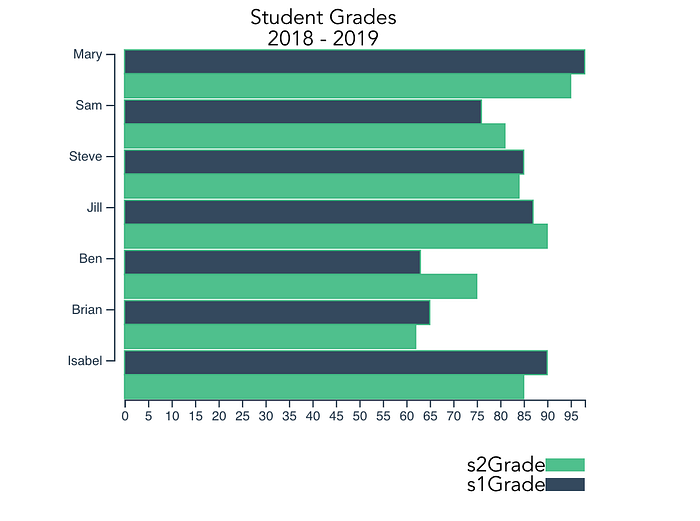
npm install v-chart-plugin@0.3.0 --saveThere are quite a few updates with regards to goal setting, additional charts, optimizations, and bug fixes. What I plan to focus on is the biggest update: multivariate charts. In order to incorporate a chart with multiple metrics, it is simply a matter of passing the array of metric values in the configuration as well as the array of colors to use for each metric:
export default {
  name: 'HelloWorld',
  data() {
    return {
      chartData: {
        chartType: 'barChart',
        selector: 'chart',
        title: 'Student Grades',
        subtitle: '2018 - 2019',
        width: 400,
        height: 400,
        metric: ['s1Grade', 's2Grade'],
        dim: 'Name',
        data: grades,
        legends: {
          enabled:  true,
        },
        overrides: {
          palette: {
            fill: ['#34495E', '#4fc08d'],
            stroke: '#41B883'
          },
          x: {
            ticks: 20
          },
          y: {
            axisWidth: 40,
          }
        }
      },
    };
  },
};
And with that, we have our multivariant chart.
Update — v1.0.0
We just released our version 1.0.0 version of the plugin. Thank you to everyone who has expressed interest in the tool. If you have any thoughts on how we can improve the tool, want to report a bug, or want to contribute I highly encourage you to fork/star our GitHub. We’ll be taking a short hiatus but we’ll be looking to add more customization, more features and, of course, more charts to the plugin based on feedback and questions.
Happy charting.