Optimizing Compilation Time for Swift Code

I have seen lots of articles and questions on forums around the slowness of the Swift build. I know there are several articles, however, mostly scattered.
I am gone try to cover those together and will provide the all the reference links in the article.
The project development is an incremental process and takes a good amount of time to build.
How will we observer the slowness in the build time?
Do we need to keep my eye on the watch every time I build my project? Someone else should point out it to us?
We should feel frustrated while waiting to compile the code to check our changes.
Let’s know some tricks and techniques:
1. Enable build duration setting in Xcode. This produced new measurements that I could easily compare with the old:
Go to the terminal:
$ defaults write com.apple.dt.Xcode ShowBuildOperationDuration YES
2. Let’s try to know how much time an individual function is taking to compile and if it hits a specific limit raise an alarm.
-Xfrontend -debug-time-function-bodiesNOTE: We have to go to XCode Build Report Navigator (Last Tab of Navigator Section) -> Select the last build -> On the right side look for the ‘Compile Swift Source files’ -> Expand the arrow -> Select ‘Compile Swift Source files’ -> Click on the three lines button on right side of your selection. You will able to see the compile time of every section.

Above soultion looks ok to me but every time going to build settings and checking won’t be handy.
Do we have any other simpler, handy and easy approach?
Let’s try to find out a way which can be more intuitive instead of looking at report navigator and make our life miserable.
3. Build our project through command line and just redirect the output in the text file as shown below.
xcodebuild -project MemoryManagement.xcodeproj -scheme MemoryManagement clean build | grep ms | sort -nr > IndividualFunctionBuildTime.txtAbove approach seems good if we compare with the 1st approach in this article. Still, I feel we are expecting a lot from our development team.
After every build a development team will manually go and check ‘IndividualFunctionBuildTime.txt’ and find out the top say 10–20 culprit functions and will try to optimize it.
Really? Too many expectations.

4. Add below lines in the project build settings ‘Other Swift Flags’
-Xfrontend -warn-long-function-bodies=300
-Xfrontend -warn-long-expression-type-checking=300
This flags will warn you if the function or expression is taking more time then you have specified. That means you have to optimize your function or expression.

These approaches will help us to identify/address the build compilation time issue.
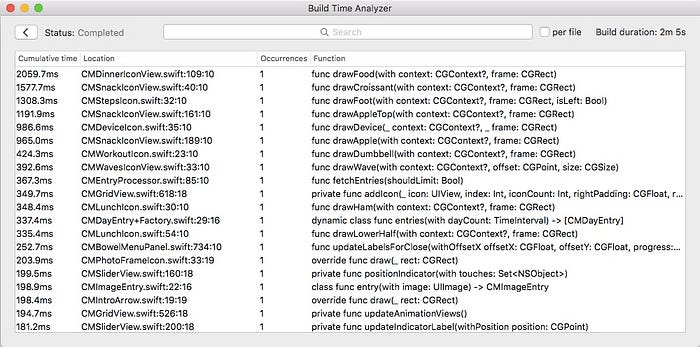
5. Use the application called Build Time Analyzer is a macOS app that shows you a break down of Swift build times.

Isn’t it great that we know the reason for the slowness of the build?
Now the point is how to address these issues?
Mainly there are couple of approaches to reduce the build time,
1. Code optimization
2. Appropriate build settings
3. Xcode configuration
The 2nd approach is easy to adapt and give us a notable result in terms of recovery in the build time.
Optimizing the code is also give us a good improvement in the build time but we need to invest more time. In terms of changes in the code, logic, unit testing the code, and end to end test run.
Let’s start with quick and simple approach first,
Appropriate Build Settings
- Make sure Build Active Architecture Only is set to ‘Yes’ for Debug builds.
- Make sure Build Options → Debug Information Format (DEBUG_INFORMATION_FORMAT) is set to DWARF for Debug builds.
Just for the simplicity DWARF has been just a debug file and DWARF with dSYM file is a debug file along with symbolification file.
Read me to understand DWARF and DWARF with dSYM
- Whole Module Optimization (WMO)
In Xcode, we have the option to select three optimization levels: None, Fast and Fast, Whole Module Optimization.
Using Whole Module Optimization makes compilation very fast. But choosing Fast or Fast, Whole Module Optimization won’t allow a developer to debug the application.

- Optimization Level
There are two different section for Optimization Level
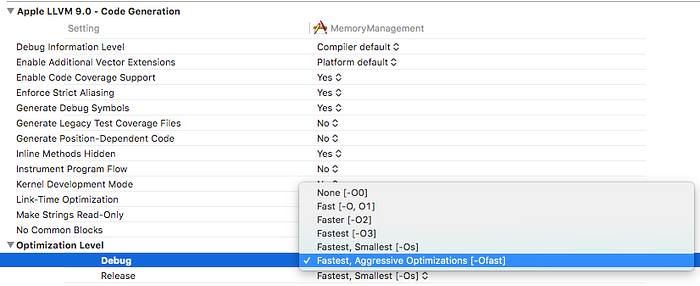
1. Apple LLVM 9.0 Code Generation -> Optimization Level -> Debug
There are 6 optimization level for GCC_OPTIMIZATION_LEVEL.
GCC_OPTIMIZATION_LEVEL =
fast (Fastest and Aggressive Optimization)
s (Fastest and Smallest)
3 (Fastest)
2 (Faster)
1 (Fast)
0 (None)

Important: Don’t play with this setting as Swift doesn’t use that optimization setting.
So the lesson is that new Swift developers coming from a legacy of Objective C, C++, or C development need to take stock of Swift compiler settings because they are liable to be rooted in completely different build settings.
Read me to know more.
2. Swift Compiler Code Generation -> Optimization Level -> Debug
There are 3 optimization level for SWIFT_OPTIMIZATION_LEVEL
SWIFT_OPTIMIZATION_LEVEL =
-Onone
-O (Fast Single File Optimization)
-Owholemodule (Fast, Whole Module Optimization)

Using Whole Module Optimization makes compilation very fast. But choosing Fast or Fast, Whole Module Optimization won’t allow a developer to debug the application.
We will try to get in little deeper to understand who this impact your build timings.
‘-Owholemodule’ is an optimization mode of the Swift compiler. The compiler optimizes all files of a module as a whole.
‘O’ Single file optimization the compiler driver starts the compilation for each file in a separate process, which can be done in parallel. Also, files which were not modified since the last compilation don’t need to be recompiled (assuming all dependencies are also unmodified). That’s called incremental compilation.
Read me to know more.
XCode configuration
1. Xcode will use the same number of a thread as cores our CPU has.
If your Mac has two cores, so by default Xcode will use a maximum of two threads. Increasing the number of threads Xcode uses can provide a significant performance boost for compiles.
Let’s try configuring Xcode to use 3, 4 or 8 threads and see which one provides the best performance for your use case.
You can set the number of processes Xcode uses from Terminal as follows:
$defaults write com.apple.Xcode PBXNumberOfParallelBuildSubtasks 42. Increases the number of concurrent build tasks that are run for Swift projects.
$defaults write com.apple.dt.Xcode BuildSystemScheduleInherentlyParallelCommandsExclusively -bool NO3. Use New Build System
This is a “preview” and is not enabled by default. It can be significantly faster than the default build system. To enable it, go to Workspace or Project Settings from the File menu in Xcode. There you can switch build systems to the new build system preview.
4. Remove the ‘Run Script Phase’ if you have any. Like SwiftLint, Twine etc.
Code Optimization
1.We can optimize the code which will help us to improve the compile time.
We have added the other linker flags -warn-long-function-bodies & -warn-long-expression-type-checking to identify the functions and expressions which are taking to much time to compile now we need to optimize those expressions or functions MANUALLY.
2. 3rd party dependencies
There are a couple of very popular dependency management techniques/tools.
a. Cocoa Pod: Compiled each time you perform a clean build of your project
b. Carthage : A prebuilt framework/library — Faster
c. Swift Package Manager
d. git Submodule : Compiled each time you perform a clean build of your project
3. Benchmarking for methods in extension v's methods in the class itself.
Choose wisely as every choice has its own pros and cons.
References:
Optimizing Swift Build Time
Speeding Up Swift Compile Time
How to make Swift compile faster

✉️ Subscribe to CodeBurst’s once-weekly Email Blast, 🐦 Follow CodeBurst on Twitter, view 🗺️ The 2018 Web Developer Roadmap, and 🕸️ Learn Full Stack Web Development.


