Practical Introduction to JavaScript Debugger;

Hello guys! It’s almost the end of the first quarter of the year. To help us end it well I’m going to give us tips on how to use the JavaScript {Debugger;} statement effectively to debug our JavaScript code effectively.
What is JavaScript Debugger; ???
The JavaScript Debugger Statement is used to debug JavaScript code. It can be placed inside a function so as to help debug the function whenever we need to.
How Does it Work???

For example, let’s reverse a string with JavaScript and use the debugger statement to debug it.

Now we’ve established the code, ooh and if you noticed I’m using the ES6 syntax don’t be scared if you haven’t ported to ES6 you can still use the statement.
Now, let’s drop in our debugger Statement. The debugger statement is to be put just before the main logic of the function. This is done because as we all know the computer reads from TOP to BOTTOM and from LEFT to RIGHT. So when the computer gets to reading the code and encounters the debugger statement it will because in execution and give us a chance to inspect some of the different variables that are in our program.

This makes it extremely useful for debugging code or developing an Algorithm solution.
To be able to use the debugger statement in a function, we’ll have to call the function after defining it like so;

If we run this in debugger mode, when the computer reaches the debugger statement it will pause at execution and allow us to inspect the different variables in the code. (I know I’m repeating myself Goddammit, It’s for you all to understand the key concept).
Debugger Mode in the Terminal.
Now to test our debugger statement we’ll be using a Terminal for those with Linux and Mac-OS you’re safe and for the Windows guys I don’t advice you using the Command Prompt, I advice using the Git Bash (That’s if you haven’t already started using it).
Now, Having installed the required things, Head over to your Terminal and make sure you have installed Node.
To go in Debugger mode, Navigate to your working directory and type
cd
cd <your project folder>
While in your project folder Run
node inspect < file you want to debug >
e.g
node inspect index.js
when you have run it this should display this output:
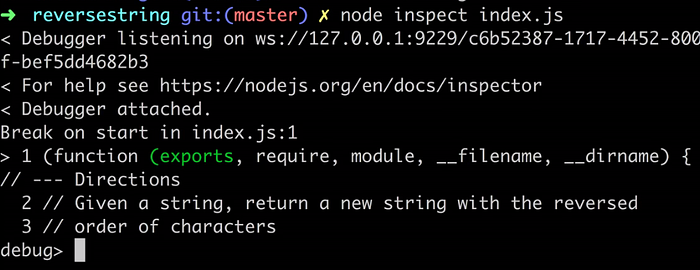
You see where the debug statement is that’s where we will write our commands
So we just launched that file in debugger mode.
WHAT NEXT??
To tell the debugger to continue debugging our code you can run the command
Continue //or
Cont  //or
C
If you run the command this should be our output:
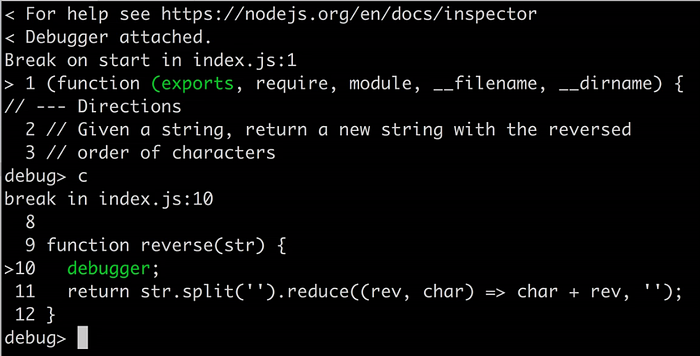
In the terminal, you will see our entire function displayed and the debugger statement highlighted in green. That’s how sweet the debugger statement is.
To inspect a variable let’s say the (str), you can’t just write str and expect it to work, if ‘str’ is entered here is what will be displayed
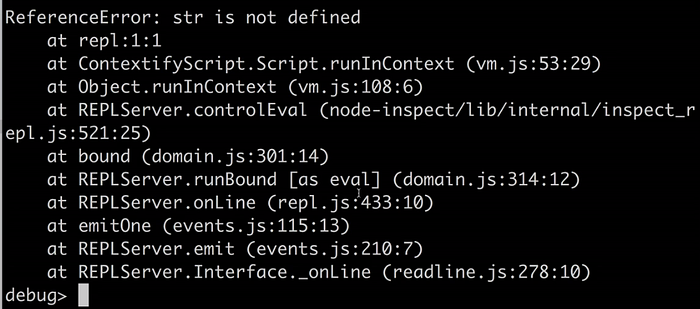
To be able to make this work we’ll have to enter the REPL mode which stands for Read–Eval–Print Loop
To enter the REPL mode we run the command
replThis should be the output:

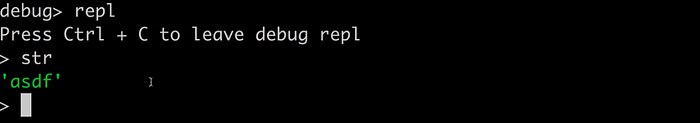
Inspecting our Variables In REPL mode
When you are in REPL mode, It opens a JavaScript console that you can use to inspect variables now lets inspect the string. Typing str should bring out ‘asdf’ because we assigned asdf as our str in our code.
Now what if we put in the main logic of our function i.e we reverse the string ‘asdf’, if our function works it will return ‘fdsa’ so lets try it out . If i copy this:
str.split('').reduce((rev, char)=> char + rev, '');
and paste it in the repl console it should return the reversed string like this

Remember to copy and paste in a terminal is
ctrl + Alt + C //Copy
ctrl + Alt + V //Paste
To leave REPL mode and go back to debug mode hit Ctrl + C
When in debug mode we’ll run the code again just to show us another issue .
In a single session the debugger can run for as many times as where the debugger statement appears
Since i assigned it in only one function this is the output when put in C

It shows just that message because there is no debugger statement in our code.
To Leave the debugger type .exit
And That’s it , A Practical Intro to JavaScript Debugger;
Hit me on twitter to say HI! or Ask a Question.
Gracias Amigos!

✉️ Subscribe to CodeBurst’s once-weekly Email Blast, 🐦 Follow CodeBurst on Twitter, view 🗺️ The 2018 Web Developer Roadmap, and 🕸️ Learn Full Stack Web Development.