React Native Debugging Tools
This article introduces how to debug code (logic) and GUI of React Native apps. Originally it was the talk I made at a React.js/React Native meetup in April 2017. (This article was updated on Mar 17, 2018.)

“A great software developer must be a great debugger.”
The beginners all have a problem. They don’t know how to debug the code. It’s even worse in React Native world. Even if you are an experienced iOS/Android developer, when you begin to learn React Native, you may struggle in debugging React Native apps. The reason is we write Javascript code but Xcode/Android studio doesn’t support debugging Javascript code. I had this problem before. So I spent a lot of time figuring out how to debug code and GUI of React Native apps in the efficient way.
Debugging code(logic) with Chrome
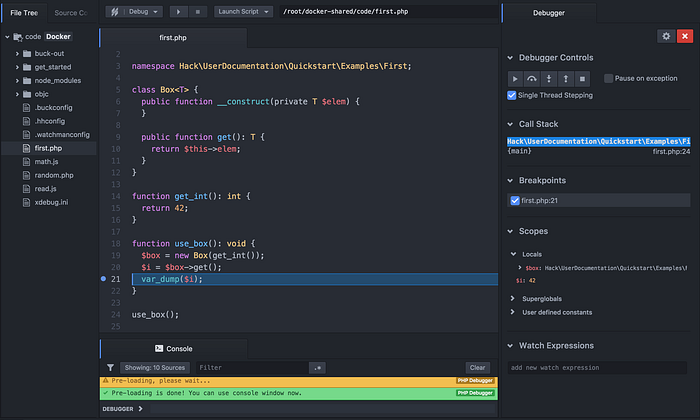
The simplest way of debugging code is to use Chrome. You don’t need to install any other apps. Press ⌘+D on iOS simulator, ⌘+M on Android emulator, or shake real devices, you will see the in-app developer menu. Tap “Debug JS Remotely”. The Chrome debugger will be opened automatically. You still need to open Developer Tools in Chrome manually. Open source files in the Sources tab, you can set breakpoints here. (Update on Feb 26, 2018: due to a bug in React Native Android, if the app says it failed to connect the debugger and the URL in Chrome is not http://localhost:8081/debugger-ui/, change the URL to http://localhost:8081/debugger-ui/, kill the app, and try again.)


Debugging code (logic) with Nuclide
Nuclide is a plugin of Atom text editor, made by Facebook. It is very useful to develop React Native apps. (Update on Feb 26, 2018: Nuclide dropped the support of debugging Node.js and React Native in June 2017 and brought it back in early 2018.) (Atom is not my favorite editor. But I highly recommend every React Native developer to use Atom+Nuclide.) To use Nuclide to debug React Native app, you need to do the following steps:
- Click the Atom menu Nuclide > Debugger > Show
- Click “Attach debugger…” button.
- In the popup dialog, select “React Native” tab.
- In “Workspace path (should contain package.json):” text field, input your project’s full path.
- Click “Attach” button.
- Open the in-app developer menu. Tap “Debug JS Remotely”. (If you were debugging app using Chrome, you need to “Stop Remote JS Debugging” and close Chrome first.)
Then you can set the breakpoints directly in Atom. When a breakpoint is caught, you can check Call Stack, inspect variables. It’s very convenient. You don’t have to leave your editor and open Chrome. You can do all in your editor directly.
Debugging with console.log
console.log is very useful when we debug web apps. We can also use it in React Native apps. But many people don’t know where the output goes.
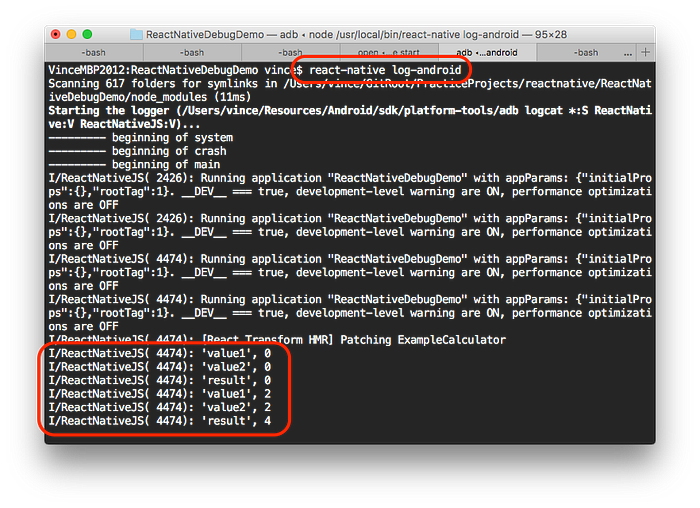
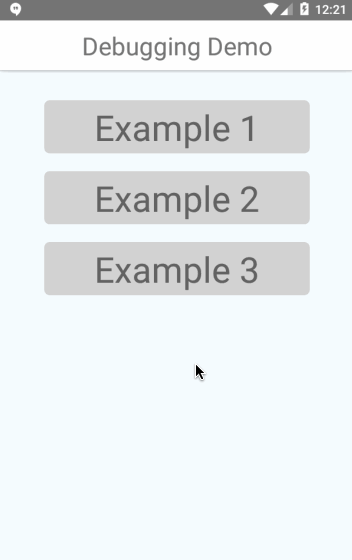
You can see the output in Terminal. Just run command react-native log-ios or react-native log-android in Terminal. You will see something like this. You can download my demo project here. Example 1 is a calculator. But there is a big bug. Uncomment line 49–51 to enable logs, run the app and open Example 1.
If you are debugging with Chrome, you can see logs in Chrome console window. Actually we still can use Xcode and Android Studio (to debug native code). We will see logs in output window.


In Nuclide, you can click menu Nuclide > ADB Logcat > Start or Nuclide > iOS Simulator Logs > Start. You will see logs in Console window of Atom. This is my favorite way to check logs. Surprisingly, it’s much faster than Terminal. It usually costs me minutes before I can see logs in Terminal.

There is a way to show the output directly in the app, without using any external command. You can use console.warn() which shows the output in the yellow bar at the bottom of the app. (I just knew it from a colleague on Feb 26, 2018. Thanks!)
Use debugger or use console.log?
It’s up to you. And you can use both. I don’t always use debugger. I use debugger only when it is really necessary. The reason is I always enable Hot Reloading. Hot reloading is super handy. We can see the changes immediately without restarting the app. But when you are using debugger, it boosts the RAM/CPU usage a lot.
Sometimes you can’t use debugger. For example, when you want to debug touch-related code, you have to use non-blocking way like console.log, because debugger may terminate your touch.
In Example 2 of my demo project, I put a scroll view into a panel which responses to touch using PanResponder. But the scroll view does not work. (The same scroll view works well if it is not in the panel.) That’s because PanResponder is not used correctly. Logs can help you understand PanResponder better. The correct code is commented out. You can uncomment to let scroll view work well. I will not go deeper into PanResponder, because it’s off topic.
Debugging GUI
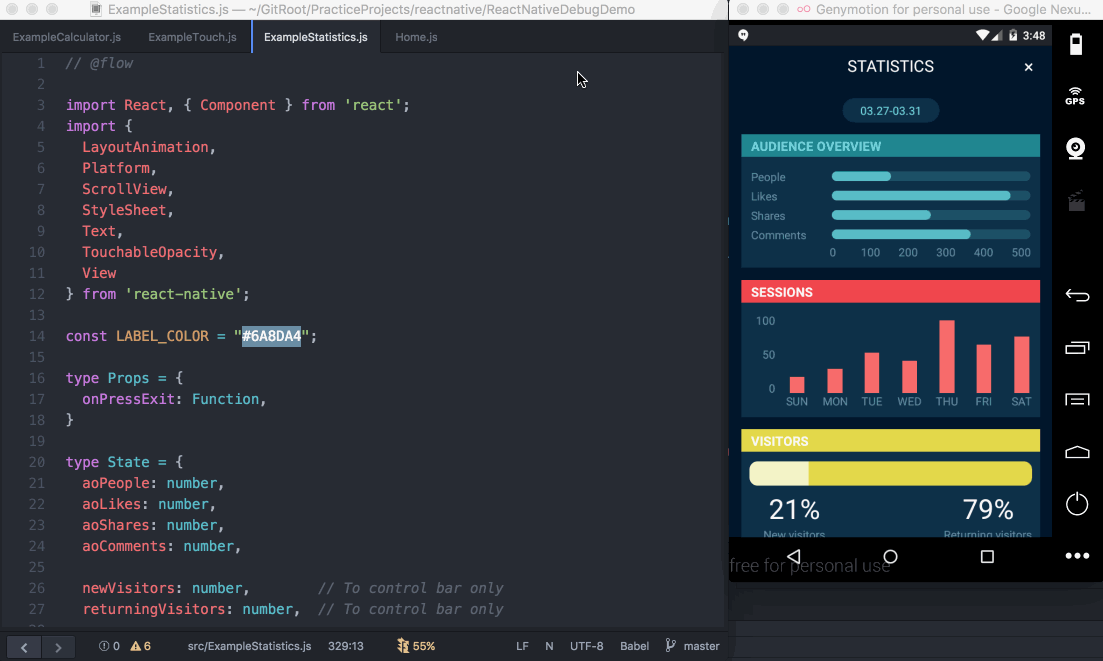
App developers usually spend most of their times on GUI. React Native provides built-in inspector. We can open it by pressing ⌘+M / ⌘+D in simulator, and choose “Toggle Inspector”. In Example 3 of the demo project, I created a little bit complex view.
You can see in the animated gif, when you open the built-in inspector, you can tap a control and see it’s margin, padding, location, size, and styles, just like what we do in a browser’s developer console. But we cannot change styles with the built-in inspector.
There are two ways to change styles live. One is enable hot reloading. When you change something in code and save the file, it will be reloaded automatically. The other way is use React Inspector, which is a built-in tool of Nuclide. For unknown reason, the menu item of React Inspector was removed from Nuclide, but we can open it by pressing ⌘+Shift+P in Atom and typing “Inspector”. Then you need to open the built-in inspector of the React Native app.
You can see in the animated gif, the components in React Inspector are grouped in a tree. When the cursor moves to a component, it is highlighted automatically in the app. When we need to understand the structure of other people’s app, this tool helps a lot. Changing style is easy. In this example, I changed the background color easily. You can also add new style with React Inspector.
If you don’t use Nuclide, you can use React DevTools which exists both as a browser extension (for Chrome and Firefox) and a standalone app. The standalone app works with React Native. Actually React Inspector of Nuclide is built on top of React DevTools.
Use Xcode to debug GUI
In React Native apps, all controls we see in the app are native controls. That’s why this technology is named React Native. This means we can utilize the power of Xcode.
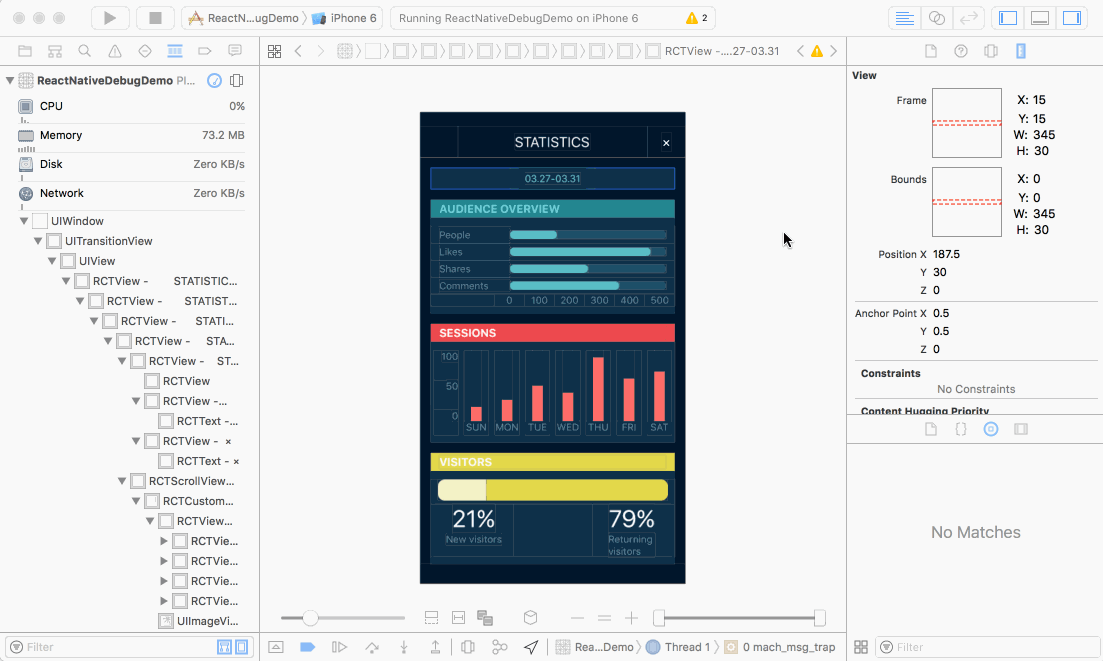
After run the app through Xcode, click “Debug View Hierarchy” button, Xcode makes a snap shot of all views. You can inspect the hierarchy in the Navigator window. Click a view, you will see its coordinates in the Size Inspector.
The coolest feature of Xcode is the 3D view inspector. You can drag the view and move. It shows views in 3D. It is very useful when you need to solve some weird problems in views. For example, in Example 3, a 💩 was missing and I found it with the 3D view inspector. It was covered by other views.
You can get the source code of the demo app at https://github.com/vinceyuan/ReactNativeDebugDemo.