Redux Devtools for Dummies

- How does one set up the fancy redux devtools in a redux environment?
- What all is happening inside the inspector tools?
Do you take one look at the docs and just give up? Did you know that you can completely control the currently running application’s actions/state through these tools?
Redux Devtools Set-up
Step 1.
The first step is the easiest to understand and complete. Hopefully you are ether on Firefox or Chrome because these are the quickest to get up and running (other options).
Go to the following links and install the browser add-on or extension:
This extension is important for connecting your browser to the Redux application. Without it, you will not be able to load the tools from your console.
Step 2.
There are multiple different ways to wire up your new dev-tools. This is because redux applications can be so different. Thus the need to have different options. In my opinion, this is the most robust and easiest to set up.
npm install --save redux-devtools-extensionimport { composeWithDevTools } from ‘redux-devtools-extension’;into the store file.- Finally compose your store with the imported module:
import { composeWithDevTools } from 'redux-devtools-extension';

const store = createStore(reducer, composeWithDevTools(
  applyMiddleware(...middleware),
  // other store enhancers if any
));
I recommend using this option over the others because it helps avoid issues with isomorphic applications. It also allows a lot of customization to the console dev tools.
Side note: If you’re hungry for more after reading this article. Check out the additional features you can add and remove to the console here
Here is how one would add in those customized features:
import { composeWithDevTools } from 'redux-devtools-extension';

const composeEnhancers = composeWithDevTools({
  // Specify custom devTools options
});
const store = createStore(reducer, /* preloadedState, */ composeEnhancers(
  applyMiddleware(...middleware),
  // other store enhancers if any
));
Also, if you do not have enhancers/middleware in your application, there is a more straight forward approach:
import { devToolsEnhancer } from 'redux-devtools-extension';

const store = createStore(reducer, /* preloadedState, */ devToolsEnhancer(
  // Specify custom devTools options
));
Notice that we are using devToolsEnhancer here rather than composerWithDevTools. The key here is that composeWithDevTools is needed when your Redux store needs enhancers. Otherwise, you can just use devToolsEnhancer.
DevTools Console Break-down
Now that we have everything set up, let’s get into the fun stuff. If you’ve installed the browser extension correctly, you will see a Redux option in the console.
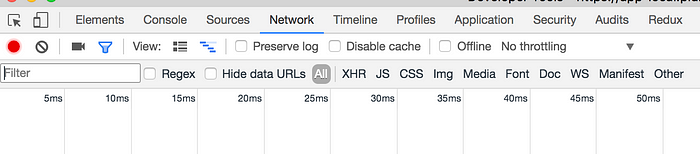
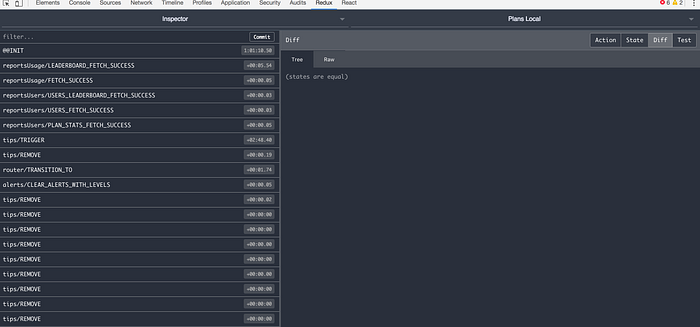
When you click on this new option, you will see one of two things. If you installed everything correctly in your store initialization, it will show you something like this:
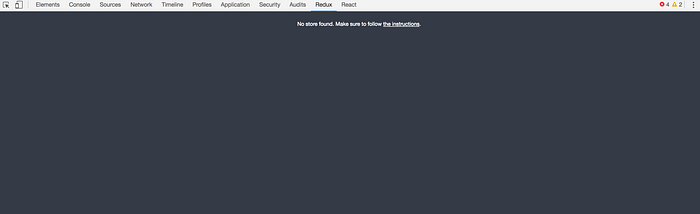
If there is an error in your set-up, including exceptions thrown from your code, you will see this:
Let’s break down whats happening in each section of the dev tools.
Left-Side Console Tools
The left hand column of the dash is showing in real time the actions that are firing on the current page (as defined by the action creator types).
This comes complete with a filter option at the top and the time each action fired after the previous one.
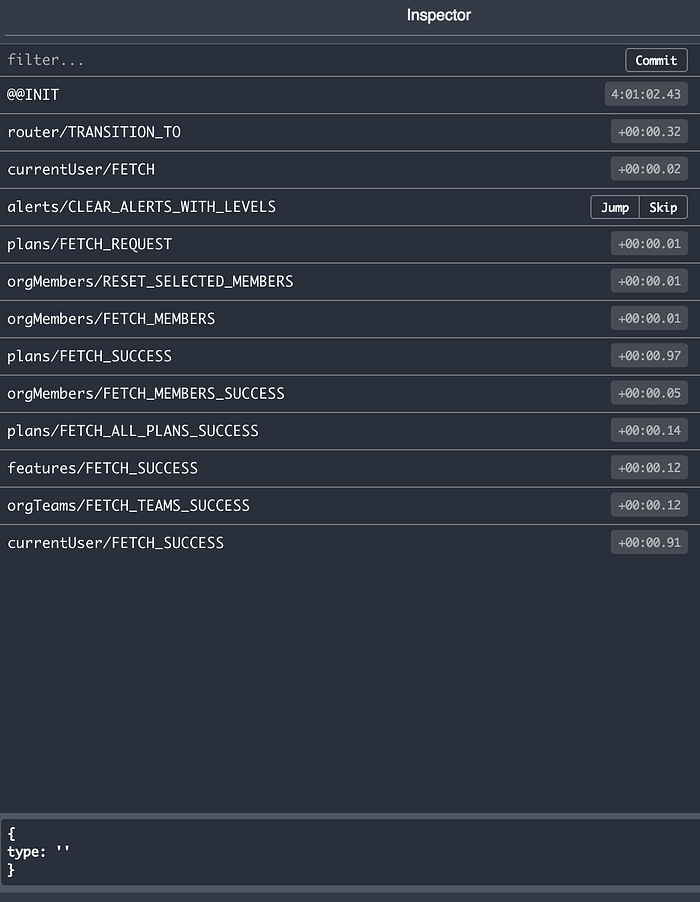
When you click on an individual action it displays two options (Jump and Skip). This is the first introduction to time traveling and changing the application view. Jump will take your application to the state of the app at the time this action fired. The skip will cross out the action and show you your app without that action.
Right-Side Console Tools
The four tabs at the top right are in my opinion the most helpful of the tools.
Diff
The right side of the console has multiple options to see the state of the application and the relation of each action to the state.
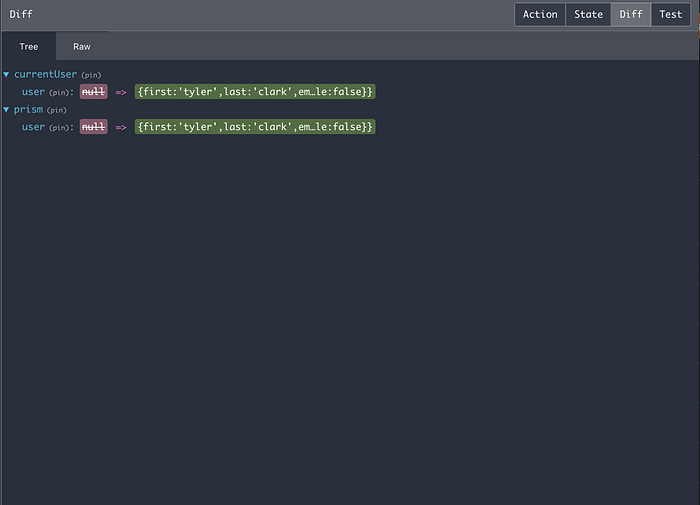
When an action is selected in the left hand side of the console, the Diff option will show only what that individual action changed in the state tree.
Action
Clicking on the Action tab will show the individual action type and any data it is carrying along to the reducers.
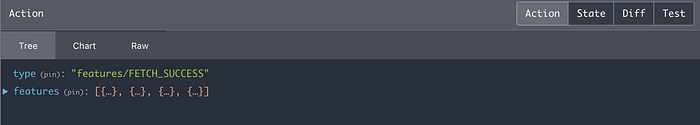
In the example above, this action has a type features/FETCH_SUCCESS and also carries data, the requested features to the reducer. You might have noticed that there are three sub tabs Tree , Chart , Raw within this master Action tab. These display the same data just in different formats.
- The
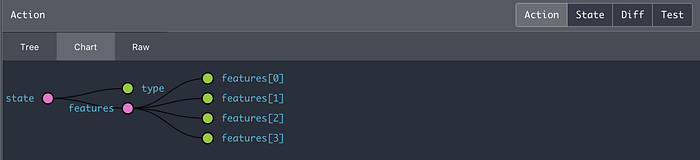
Treeview is the default view and summarizes the data into single lines. - The
Charttab shows the up-to-date store tree. Including all of the combined reducers and their corresponding data branches.
- The
Rawtab shows the action creator in a code view.
State
The state tab shows the entire state tree at the time of the action selected in the left hand side of the console.
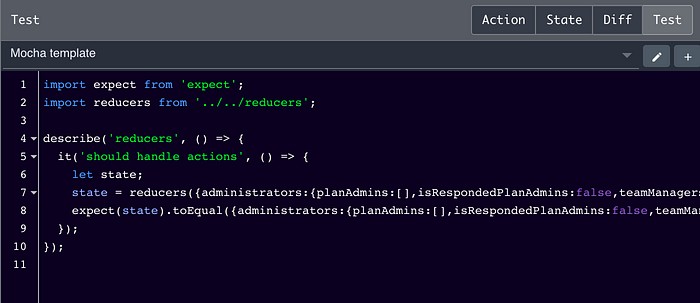
Test
Back to the upper tabs, there is a test option. This will create a test format in some pre-provided testing frameworks. It takes your root state and provides a written test on what the end state should hold
Top Console Tools

The top of the console offers two more sets of tabs. The right tab lets you flip between different instances of running apps on the page. If you have different stores running on the same page.
The left set of tabs shows different modes:
Inspector: the most used and is the default mode. Shows all the tools that have been discussed here.Log Monitorshows complete state and actions, as opposed to theInspectormode where it just shows the diffs. (Try using the slider while in this view and watch your state tree grow/shrink!)Chartshows the state in a tree-like structure.
Magic Toolbar

The bottom of the console provides more functionality for diving into your actions and state. It allows for time travel, dispatching actions, importing/exporting state, and remote control. Starting from the far left, the first three options are for creating a new console view ether to the left, right, or bottom.
- The
Pause recordingdoes not stop other actions from firing within your app, it is just stopping the recording of actions within the console. Unlike other abilities within the console it does not control the state of your running browser page. - The
Lock changeswill actually freeze the running app’s other/future actions. So it takesPause recordingto the next level by locking any future state changes in your app. - The
Persistoption will keep the current state even when the page reloads - The
Dispatcheroption will ether show or hide the dispatching module. Which can be used to fire a custom action with custom data.

- The
Slideroption will give you a smooth scroll through the actions. This will time travel through the actions that have fired and update the running app to show the current state and certain points in time. This comes packed with an auto-play, one step action arrows, and a speed interval play-through time.

- The
importandexportoptions are for importing/exporting state as JSON into the application. Which enables you to run your app off of custom state. - The
Remoteoption creates a separate console, not connected to the browser console tools. This will run the same actions but “remotely” away from the dev-tools.
TL;DR
- Install Redux browser dev-tools (Chrome and Firefox)
- Install dev-tools npm package and import it into store file
- Open developer tools with app running and click on the Redux option.
- Console tools show running actions and state. It provides time traveling, detail charting, and customization to actions/state.
<a class="twitter-follow-button"
  href="https://twitter.com/TwitterDev"
  data-size="large">
Follow @TwitterDev</a>