Simple Data Visualization with React JS: SVG Line Chart Tutorial
Learn how to build an SVG line chart in React (No 3rd party graphing libraries necessary!)

Part two of this tutorial is now live: How I built an Interactive 30-Day Bitcoin Price Graph with React and an API
What we’ll be building
Today we’ll be building a very simple line chart using React and SVG. In later tutorials we’ll add more complexities to this project: tooltips on hover, axis labels, etc.
You’ll understand this tutorial better if you have basic react and SVG knowledge, although it is not required.
- GitHub Code Repository Here
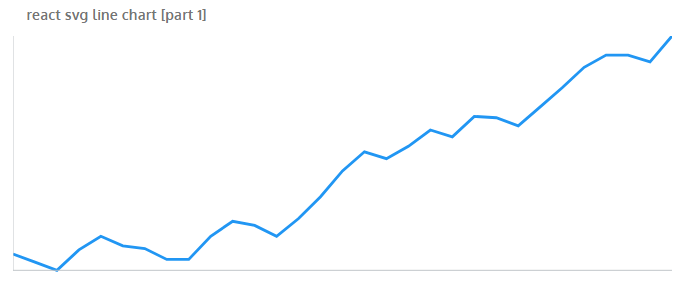
- And here’s what our line chart will look like:
Create React App
For this tutorial we’ll be using create-react-app to scaffold out a react application quickly and efficiently. If this tutorial interests you, I strongly recommend you check out my 3 Best React JS Courses where you can learn to build some larger scale, (really cool) real-world react applications!
Create your application by running:
create-react-app react-svg-line-chartOnce the installation is finished, change directories into our project folder and start up the server to make sure everything worked correctly:
cd react-svg-line-chart
npm start
You should see the following:

Wait. What is SVG?
Before we continue, we’re going to step back for a second and examine SVG.
SVG stands for Scalable Vector Graphics. SVG allows us to create vector graphics based around shapes. SVG is awesome because it is resolution independent. This means SVG’s are created based on mathematical formulas and x & y coordinates. SVG is also highly searchable, modular, and fast.
Don’t freak out. SVG’s aren’t scary. Lets take a look a simple SVG:
<path d="M 10 10 L 20 20 z"/>- The
<path>element defines the shape of our svg. dattribute is a string containing a list of path instructions.Mmeans ‘move to’. In this instance, move to point x=10, y=10.Lmeans ‘line to’. In this instance create a line to point x=20, y=20.zmeans ‘close’. It ends our SVG element
The above code results in a simple line from point 10,10 to point 20,20.
It’s important to know that SVG coordinates start in the top left of the containing element. In this example, our line is a downward sloping line starting near the top left corner of the element.
React + SVG
Hopefully it should be clear how we can use React & SVG to create a line chart. All we need to do is render an SVG line based on the data React provides.
Navigate back to your react-svg-line-chart directory and continue reading…
Create Fake Data
In order to create a line chart, we need data! For the purpose of this tutorial, we’re going to create a function that supplies us with data.
Clear out your app.js file and replace it with the following:
import React, { Component } from 'react';
import './App.css';class App extends Component {
  createFakeData(){
    // This function creates data that doesn't look entirely random
    const data = []    for (let x = 0; x <= 30; x++) {
      const random = Math.random();
      const temp = data.length > 0 ? data[data.length-1].y : 50;
      const y = random >= .45 ? temp + Math.floor(random * 20) : temp - Math.floor(random * 20);
      data.push({x,y})
    }
    return data;
  }render() {
    return (
      <div className="App">
        // THIS IS WHERE OUR SVG CHART WILL RENDER
      </div>
    );
  }
}export default App;
I’m not going to extensively walk you through the function above as that’s not the focus of this tutorial. However here are the highlights:
- We now have a function called
createFakeData() - When invoked, the function uses the built in JavaScript method
Math.Random()to create 30 random data-sets which we will later be graphing. - The 30 data-sets are returned as an array of objects. Each object contains an x value and a y value:
[{x,y},{x,y},…]
LineChart.js
Back in our project folder, create a file named LineChart.js in your src/ directory. This file will be our chart component.
First, we’ll set up the file as a React Component that returns an SVG:
import React, {Component} from "react"
import "./LineChart.css"class LineChart extends Component {
  render() {
    return (
      <svg>
      </svg>
    );
  }
}LineChart.defaultProps = {
  data: [],
  color: '#2196F3',
  svgHeight: 300,
  svgWidth: 700
}export default LineChart;
Note that I’ve include four default props:
data— defaults to an empty array. Our line chart will be non-existent if no data is passed incolor— defaults to bluesvgHeight & svgWidth— defaults to 300 x 700. Dimensions are important as they allow us to mathematically chart all points in our graph at equally spaced intervals whether we have 3 data-sets, or 3000.
Min/Max X & Y Helper Functions
Before we can begin graphing our data though, we need a few helper functions. The first four things we’ll need to know are the minimum and maximum x values in our data, and the minimum and maximum y values in our data.
Before our render() function, add in these four functions:
// GET MAX & MIN X
  getMinX() {
    const {data} = this.props;
    return data[0].x;
  }
  getMaxX() {
    const {data} = this.props;
    return data[data.length - 1].x;
  }
  // GET MAX & MIN Y
  getMinY() {
    const {data} = this.props;
    return data.reduce((min, p) => p.y < min ? p.y : min, data[0].y);
  }
  getMaxY() {
    const {data} = this.props;
    return data.reduce((max, p) => p.y > max ? p.y : max, data[0].y);
  }
Each function makes use of the data object that React will pass in as a prop from our app.js component.
Finding the minimum and maximum x values is pretty easy: It’s simply the first and last object in the data array, respectively.
Finding the minimum and maximum y values are a little more complex, but still pretty straight forward. We use the built in JavaScript Array Reduce method. Reduce systematically checks each value in an array to see if they meet a certain criteria. After working through all values, reduce returns a single value, in this case a maximum or minimum y value.
SVG Coordinate Helper
The next thing we need to do is create our SVG coordinates for each point in our line graph along the way.
To do this, we’re going to create two functions. One will get our SVG x coordinate, and the other will get our SVG y coordinate.
  getSvgX(x) {
    const {svgWidth} = this.props;
    return (x / this.getMaxX() * svgWidth);
  }
  getSvgY(y) {
    const {svgHeight} = this.props;
    return svgHeight - (y / this.getMaxY() * svgHeight);
  }
Remember our default props svgHeight & svgWidth from earlier? Here’s where they become important. The coordinate is determined by dividing the current data point by the total number of data points. This decimal is then multiplied by the width/height of the containing element.
As an example: if we have 6 data points, and our containing element is 50 pixels wide, our data points would be at 0, 10, 20, 30, 40, 50.
Create our Line Graph
We finally have everything we need to create our Line Graph! To do this, we’re going to create and return an SVG element Path:
makePath() {
    const {data, color} = this.props;
    let pathD = "M " + this.getSvgX(data[0].x) + " " + this.getSvgY(data[0].y) + " ";pathD += data.map((point, i) => {
      return "L " + this.getSvgX(point.x) + " " + this.getSvgY(point.y) + " ";
    });return (
  <path className="linechart_path" d={pathD} style={{stroke: color}} />
    );
  }
Let’s break down the above code into smaller sections:
- First we create a variable named
pathDand tell our line to move to the first x and y coordinate. This is where our line chart will start
let pathD = "M " + this.getSvgX(data[0].x) + " " + this.getSvgY(data[0].y) + " ";- Next, for each value in our
dataarray, we will return a Line to the next x and y coordinate in the array. - This line will be appended to the
pathDvariable.
pathD += data.map((point, i) => {
      return "L " + this.getSvgX(point.x) + " " + this.getSvgY(point.y) + " ";
});- Finally, we return a path element with
dequal to ourpathDvariable. - You’ll notice I’ve also included a
classNameandstyleelement for making everything look pretty.
return (
  <path className="linechart_path" d={pathD} style={{stroke: color}} />
    );
Create a Grid Axis
The last thing we’ll do in this tutorial is create a grid axis to pull everything together.
If you think about it, a grid axis is simply two straight lines. One line goes from top left to bottom left. The other line from bottom left to bottom right. Luckily, we already have four helper functions to determine the coordinates of these four locations, so the process of creating the lines is simple:
makeAxis() {
  const minX = this.getMinX(), maxX = this.getMaxX();
  const minY = this.getMinY(), maxY = this.getMaxY();return (
    <g className="linechart_axis">
      <line
        x1={this.getSvgX(minX)} y1={this.getSvgY(minY)}
        x2={this.getSvgX(maxX)} y2={this.getSvgY(minY)} />
      <line
        x1={this.getSvgX(minX)} y1={this.getSvgY(minY)}
        x2={this.getSvgX(minX)} y2={this.getSvgY(maxY)} />
    </g>
    );
  }
- First we grab our four min/max values
- Then we return two lines within a
gelement.gis simply a group element in SVG — you can think of it like adiv. - Each line needs 4 coordinates, two for starting, and two for ending. These coordinates are achieved by using our
getSVGx() & getSVGy()functions. - We
returneach line.
Returning the Axis & Line Graph
We have everything we need, now we just need to return it to the parent element.
render() {
    const {svgHeight, svgWidth} = this.props;return (
      <svg viewBox={`0 0 ${svgWidth} ${svgHeight}`}>
        {this.makePath()}
        {this.makeAxis()}
      </svg>
    );
  }
- We’ll return an SVG element with a viewbox property that starts at
x=0, andy=0, and goes to our SVG Height & Width. - Within our SVG we’ll return invocations of
makePath()andmakeAxis()which create our axis and line graph!
Making it Pretty
To make it look pretty I added the following code to LineChart.css
.linechart_path {
  stroke-width: 3; // Thick Line
  fill: none;      // No Fill
}.linechart_axis {
  stroke: #bdc3c7; // Grey Axis Color
}
Moving back to app.js
Back in app.js now all we have to do is import LineChart.js and return it. For data we’ll pass in our createFakeData() function.
You can also change the line color with color={}
import LineChart from './LineChart';
// ...render() {
    return (
      <div className="App">
        <div className="header">react svg line chart [part 1]</div>
        <LineChart data={this.createFakeData()} />
      </div>
    );
  }
You did it!
And that’s how you build an SVG line chart with React! I publish a few articles and tutorials each week, please consider entering your email here if you’d like to be added to my once-weekly email list.
If tutorials like this interest you and you want to learn how to build more cool stuff with React, check out the 3 Best React JS Courses.
