Top 6 Features of JavaScript Gantt Chart We Can Boast

dhtmlxGantt is a powerful interactive JavaScript implementation of a Gantt chart. Among the functionalities that you may face in almost every web-based Gantt chart app, there are some that we want to emphasize and describe in more detail.
Let’s get started! Here are the top features of dhtmlxGantt.
Improved Auto Scheduling
The more complex the project you’re working on, the more challenging it is to predict all potential pitfalls lying ahead. Moreover, all the tasks are interrelated. Thus, if your team and you have to make any changes, there is a big chance to face unexpected consequences and delays.
Instead of manually editing timing parameters, you may benefit from the use of the auto-scheduling functionality.

The scheduling extension enables Gantt to automatically organize tasks depending on relations between them. Our users can specify task relations by indicating when it should start/finish regarding the others. On the dhtmlxGantt chart, task dependencies are indicated as lines linking two tasks or a task and a milestone.
Let us suppose, for example, that you have two tasks connected by a dependency link. If you finish the first task sooner than expected, you can change its end date, so then the second task should move to the earlier date of the workflow. Auto scheduling updates the start date according to the end date of the previous task each time modifications occur.
Moreover, you can set additional time constraints for tasks in order to prioritize them. They make project planning faster, as Gantt will automatically schedule all tasks as soon as you put the necessary constraints on some of them. Thus, Gantt charts offer 8 types of time constraints that are set either via the lightbox constraint control or with the help of inline editors right in the grid.

Advanced Drag-and-Drop Behaviour
Dragging is a quick and easy way of rescheduling and rearranging tasks. The feature allows users to change the start/end dates and their duration without a hassle. In dhtmlxGantt charts drag-and-drop is enabled by default, thus users can move a task along its row in the timeline. Moreover, they can select multiple tasks and drag them across the timeline.
Gantt’s drag-n-drop behavior is entirely customizable. You are able to forbid moving specific tasks, restrict the dragging area, set minimal task duration, and manage the autoscroll performance during dragging.
Starting from version 6.2, dhtmlxGantt allows creating new tasks directly in the timeline area. Users can click in empty space to set the task’s start date then drag to the right to define its duration. Besides, they can create parts of split tasks with drag-n-drop in the same way.
Rich Resource Management Opportunities
When talking about resources, this refers to people, equipment, funding, or any other facility required to complete the project. The ability to manage resources is quite crucial and in demand since it allows estimating a load of project parts and each resource separately.
DHTMLX Gantt library allows assigning resources to a particular task to manage the capacity and workload of projects. Moreover, human resources can have their own separate schedule. Suppose you re-assign some tasks to another employee. Then the duration of these tasks and the project as a whole is modified according to the new working schedule.
You can configure dhtmlxGantt chart to show the resource load per day with the help of a resource histogram. This type of layout view visualizes the maximum capacity of resources and the days when they are overloaded highlighting in a bright color (e.g. red).

Gantt may have an expanded resource panel thus displaying all the tasks assigned to a particular resource. In that case, end-users will be able to understand how efforts are allocated among tasks and manage the resource load more efficiently.
Dynamic Loading of Big Data Sets
Let’s say you maintain a complex project overwhelmed by tasks and dependencies, so that it may take a lot of time to just load all the data. dhtmlxGantt tackles such challenges by offering a bunch of techniques to work with large task sets quick and smooth.
Having the dynamic loading mode enabled, data will be uploaded by sub-projects, piece by piece as the end-user will open them. Dynamic loading increases overall Gantt performance since preference is given to the top-level tasks and then goes to the nested branches.
Custom Tooltips for Gantt Elements
DHTMLX Gantt allows setting tooltips for any chart element and not just for tasks. Those little helpers provide additional info for users without overflowing the screen with text.
By default, tooltips display 3 properties of a task (its name, start and end dates) that may be replaced by a custom text. Moreover, the default tooltip behavior, as well as timeout, position, and displaying area, are totally modified according to your project needs.
Clean UI with Expanded Customization Capabilities
According to our customers, the complete customization of the apps’ appearance is among the key benefits of DHTMLX Gantt chart library. Plus, we are constantly working on updating and improving our thorough guides on styling, how-to articles, and video tutorials.
Starting from v5.1, Gantt supports RTL rendering, thus enabling all the chart elements to begin from the right and continue to the left side of the page.
For instance, dhtmlxGantt provides several built-in themes, including high-contrast skins, that may be used to instantly change the overall look of the Gantt chart. Moreover, you can use templates to tailor the format of displayed dates and labels and adjust styles and colors of separate elements (tasks, links, scale, etc.) via CSS.
Summing up, we would like to show you some examples of how dhtmlxGantt charts can be customized:
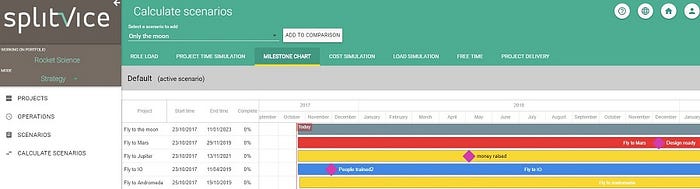
- online project management tool by Splitvice
- project management platform by Hive
Check our blog for more info. You are also invited to estimate a 30-day trial version for free and share your feedback.

