Why do you need to understand hardware to make better software?
At the beginning of the career as a software developer, everyone passes through a moment when they don’t really understand what’s going on in the code. Sometimes, you want to push the boundaries of the performance but it seems like that there is nothing else you can do.
You wrote your code in C++ instead of Java/Go. You used the algorithms with best asymptotic performance out there. You sifted through the libraries to make your code as non-blocking as possible. And still you are not getting the desired performance.
The problem is many developers don’t understand how the hardware works and they rely heavily on compilers.
What’s wrong with that?
Now, using a great compiler will definitely give you better results. Compiler already do a lot of optimisations themselves.
The problem is compilers like to play in the safe zone. If a particular optimisation can meddle with a case or two, which you might never encounter in your use case, it won’t do it.
So sometimes, it becomes the job of the programmer to write the code in such a way that compiler understands and does a better job to utilise every clock cycle of the CPU. Let’s look at some of the basic concepts.
1 + 1 != 2
int a = b + c
int d = b + c
In medieval times of computing era, this code would have taken 2 CPU cycles or more (assuming integer addition takes one CPU cycle).
However, modern CPUs don’t work like that. Modern CPUs have instruction level parallelism and multiple executions units to support them.

You can consult the site mentioned below to peek at your processor’s micro architecture.
Modern processors have two main units in a core :
- Instruction control Unit — It’s responsible for fetching the instructions from the L1-I Cache, decoding them and scheduling them.
- Execution Unit — It contains the logic to fetch and operate on data from L1-D cache such as Integer ALU, Floating point ALU, Load/Store, vector operations etc.
Let’s take a look at how many units of each type are there in the execution unit of a Coffee Lake Architecture (To be released in 2018):
- Integer ALU -4
- Branching -2
- Load data -2
- Floating point ALU -2
4 integer operations can be performed simultaneously in a core. Compiler may or may not take full advantage of that depending on the code that’s written.
Let’s run a simple benchmark. I’ll be using go lang here as it’s simple to test benchmarks in it.
func BenchmarkIsSlow(b *testing.B){

       for i:=0;i<b.N;i++{
                     func () int {
                            var acc int = 1;
                            for j := 0; j < length; j++ {
                                   acc = acc + input[j]
                            }
                            return acc
                     } ()
       }
}


func BenchmarkIsFast(b *testing.B){

       for i:=0;i<b.N;i++{
              func () int {
                     var acc1 int = 1;
                     var acc2 int = 1;

                     for j := 0; j + 1 < length; j += 2 {
                            acc1 = acc1 + input[j]
                            acc2 = acc2 + input[j + 1]
                     }
                     return acc1 + acc2
              }()
       }
}
If you run a simple benchmark using go test -bench, You’ll find out that BenchmarkIsFast is almost twice as fast as BenchmarkIsSlow (Considering you take large enough arrays)
Here are the results on my machine:
goos: darwin
goarch: amd64
BenchmarkIsSlow-4 200000 9928 ns/op
BenchmarkIsFast-4 300000 5363 ns/op
This simple optimisation is known as Loop unrolling. Most of the compilers do it by default but if there is a dependency between the loops then CPU won’t be able to take advantage of it.
In the first example, since variable acc is common between the loops the next loop requires that the register containing acc be first updated. Only then it’ll be able to proceed.
One of the best examples of this technique can be found here
The further you go, the slower you’ll be
I/O is not cheap in a system. This is a typical memory hierarchy in modern systems.
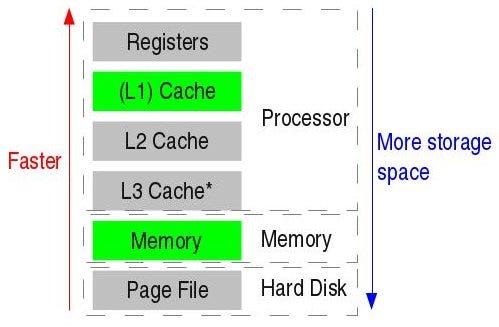
Let’s look at the sizes and access times of each of these components in latest kaby lake intel processors :
Registers — 180–300 registers
L1 Data Cache — 32 KB/core, 4 cycles
L2 Cache — 256KB/core, 10 cycles
L3 Cache — 2MB/core, 40 cycles
Memory — 8GB, 100 cycles
Disk seek— 100s of GBs, 10K cycles
So the larger the data you will try to process, the slower your program will be.
However, most of the times even using smaller data, you might have to do more memory/disk lookups then needed.
Consider the code below from this repository
func ColumnTraverse() int {
       var ctr int

       for col := 0; col < cols; col++ {
              for row := 0; row < rows; row++ {
                     if matrix[row][col] == 0xFF {
                            ctr++
                     }
              }
       }

       return ctr
}


func RowTraverse() int {
       var ctr int

       for row := 0; row < rows; row++ {
              for col := 0; col < cols; col++ {
                     if matrix[row][col] == 0xFF {
                            ctr++
                     }
              }
       }

       return ctr
}func BenchmarkMatrixColumnTraverse(b *testing.B) {
       var a int

       for i := 0; i < b.N; i++ {
              a = ColumnTraverse()
       }

       fa = a
}


func BenchmarkMatrixRowTraverse(b *testing.B) {
       var a int

       for i := 0; i < b.N; i++ {
              a = RowTraverse()
       }

       fa = a
}
The only difference between the two functions is the order in which the matrix is evaluated i.e. row-major and column-major. Asymptotically both are same, however in the benchmarks
BenchmarkMatrixColumnTraverse-4 50 28606723 ns/op
BenchmarkMatrixRowTraverse-4 300 4400235 ns/op
Row traversal is almost 7 times faster than column traversal. How? Well, that’s because in row traversal most of the time data is accessed from the cache while in column traversal you have to go to the main memory (DRAM). I have explained it in more details here
More is not always better
The most common way to make programs faster is to increase concurrency. What people forget is that concurrency is not equal to parallelism.
Take a simple example of Docker, a popular container systems. Using cgroups, you allocate 1 CPU share to the docker and rest to all the other applications.
But ajava process (before java 9) running in the docker container sees that the host machine has 64 cores and so it configures 64 GC threads, 64 JIT (Just In Time) compiler threads.
What will happen is that since the container can utilise 1/64th of the CPU cycles only, it’ll spend most of them in just doing context switches between these threads which will drastically hamper the performance of the application.
Issues like these can only be tackled if we have thorough knowledge of the hardware. Some of the resources to dive into these topics are:
Connect with me on LinkedIn or Facebook or drop a mail to kharekartik@gmail.com to share the feedback.

✉️ Subscribe to CodeBurst’s once-weekly Email Blast, 🐦 Follow CodeBurst on Twitter, view 🗺️ The 2018 Web Developer Roadmap, and 🕸️ Learn Full Stack Web Development.